CC8 Phase 3 Joint Comparison Traffic Test Results & Analysis
Objective
The objectives of Construction Cycle 8 (CC8) Phase 3 Joint Comparison Test (JCT) were:
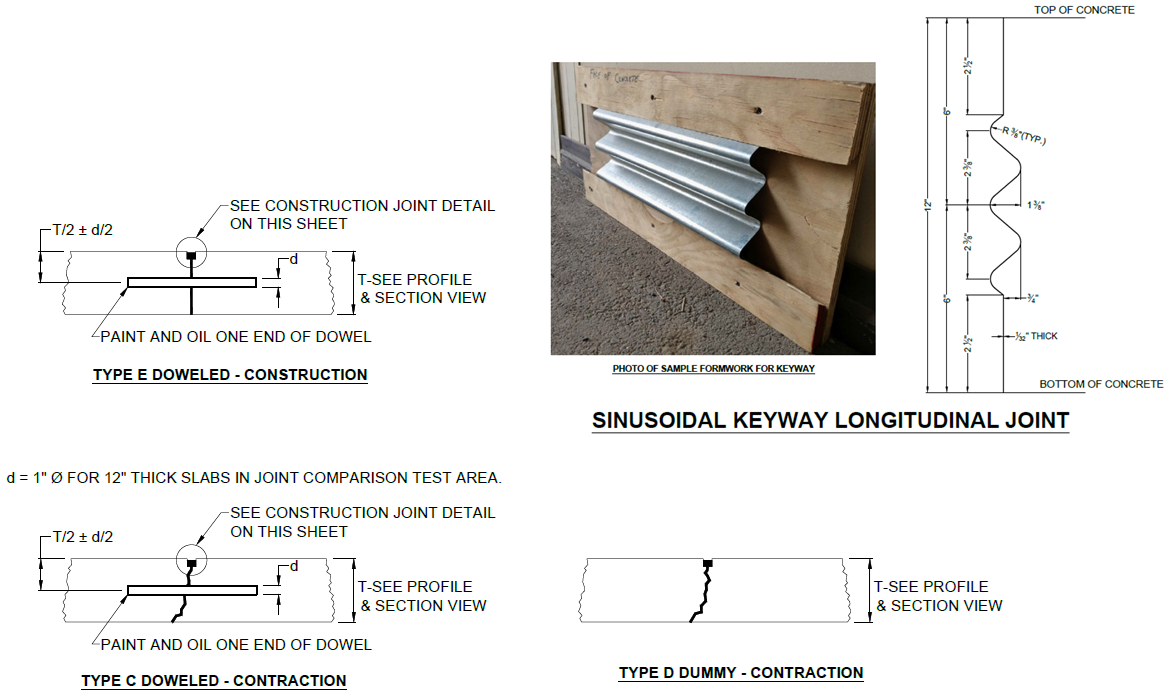
- Compare the performance of standard doweled (Type E) to sine-wave shaped keyway longitudinal construction joint and assess the benefits, if any, of one type over the other;
- Compare the performance of doweled (Type C) to dummy (Type D) transverse contraction joint and evaluate the benefits, if any, of doweling.
The figures, shown below, detail the joint types outlined in the objectives.
Traffic Test Results
The traffic test was conducted in two stages. In both stages, a ramp-up response test was conducted to identify appropriate load levels and gear configurations, followed by traffic to a predetermined failure condition. A modified failure criterion was developed based on joint performance. Failure of a slab group occurs when the average deflection-based Load Transfer Efficiency (LTEδ) of either contraction (transverse) or construction (longitudinal) joints is at 60% or below. Failure in terms of load transfer efficiency of joints was anticipated to occur after attaining the design structural failure condition of SCI=80.
Stage I Traffic Tests
The Stage I traffic test commenced on March 1, 2018. Both NAPTV carriages were configured with a D gear at a wheel load of 65,000 pounds. Longitudinal joints showed a gradual decrease in performance indicators over the first 38,346 vehicle passes but stabilized thereafter. After 17,292 vehicle passes, the SCI values of both the north and south sides reached minimum values of 14 and 34, respectively. Similar to longitudinal joint performance indicators, the SCI remained constant thereafter. With no further evidence of joint performance degradation or pavement deterioration, Stage I concluded on August 9, 2018. The total number of vehicle passes under load was 42,702. At the termination of Stage I, the joint failure criteria was met for longitudinal construction joints on both north and south traffic lanes.
Stage II Traffic Tests
The Stage II traffic test commenced on October 29, 2018 and concluded on November 8. Prior to traffic, a revised ramp-up response test was conducted using both D and 3D gears, with wheel loads ranging from 50,000 to 70,000 pounds. Following the revised ramp-up response test, traffic testing was resumed on the south side only using a 3D gear configuration with a 70,000 pound wheel load. The failure criterion was also revised. Failure would be determined by either of the following conditions: stress-based Load Transfer Efficiency (LTEσ) at longitudinal joint (S 4-10) = 60% or stress-based Load Transfer (LTσ) at longitudinal joint (S 4-10) = 25%. Based on these new joint performance criteria, traffic was halted after 3,036 additional passes, for a total of 45,738 loaded passes applied to the south pavement.
Behavior of Test Section under Traffic
Distress Mapping
Some minor surface cracks on the north side were observed prior to the start of the traffic test. Some of these cracks were directly above embedded concrete strain gages (EGs). Over the course of the traffic test, more isolated, tight surface cracks appeared on the north pavement. These isolated cracks tended to develop in a random pattern in the interiors of slabs and did not appear to be load-related. In general, the north test item developed more structural distress, developed distresses earlier, and failed earlier than the south test item. On both north and south test items, corner breaks were the dominant structural distress.
Structural Condition Index (SCI)
The figure below shows the drop in SCI over the course of trafficking for both test pavement sides, considering each test lane (north and south) as an independent sample unit. Evidently, the north pavement deteriorated at a faster rate than did the south. The number of loaded passes required to achieve similar levels of deterioration at the end of traffic was 45,738 for the south, but only 16,698 for the north.
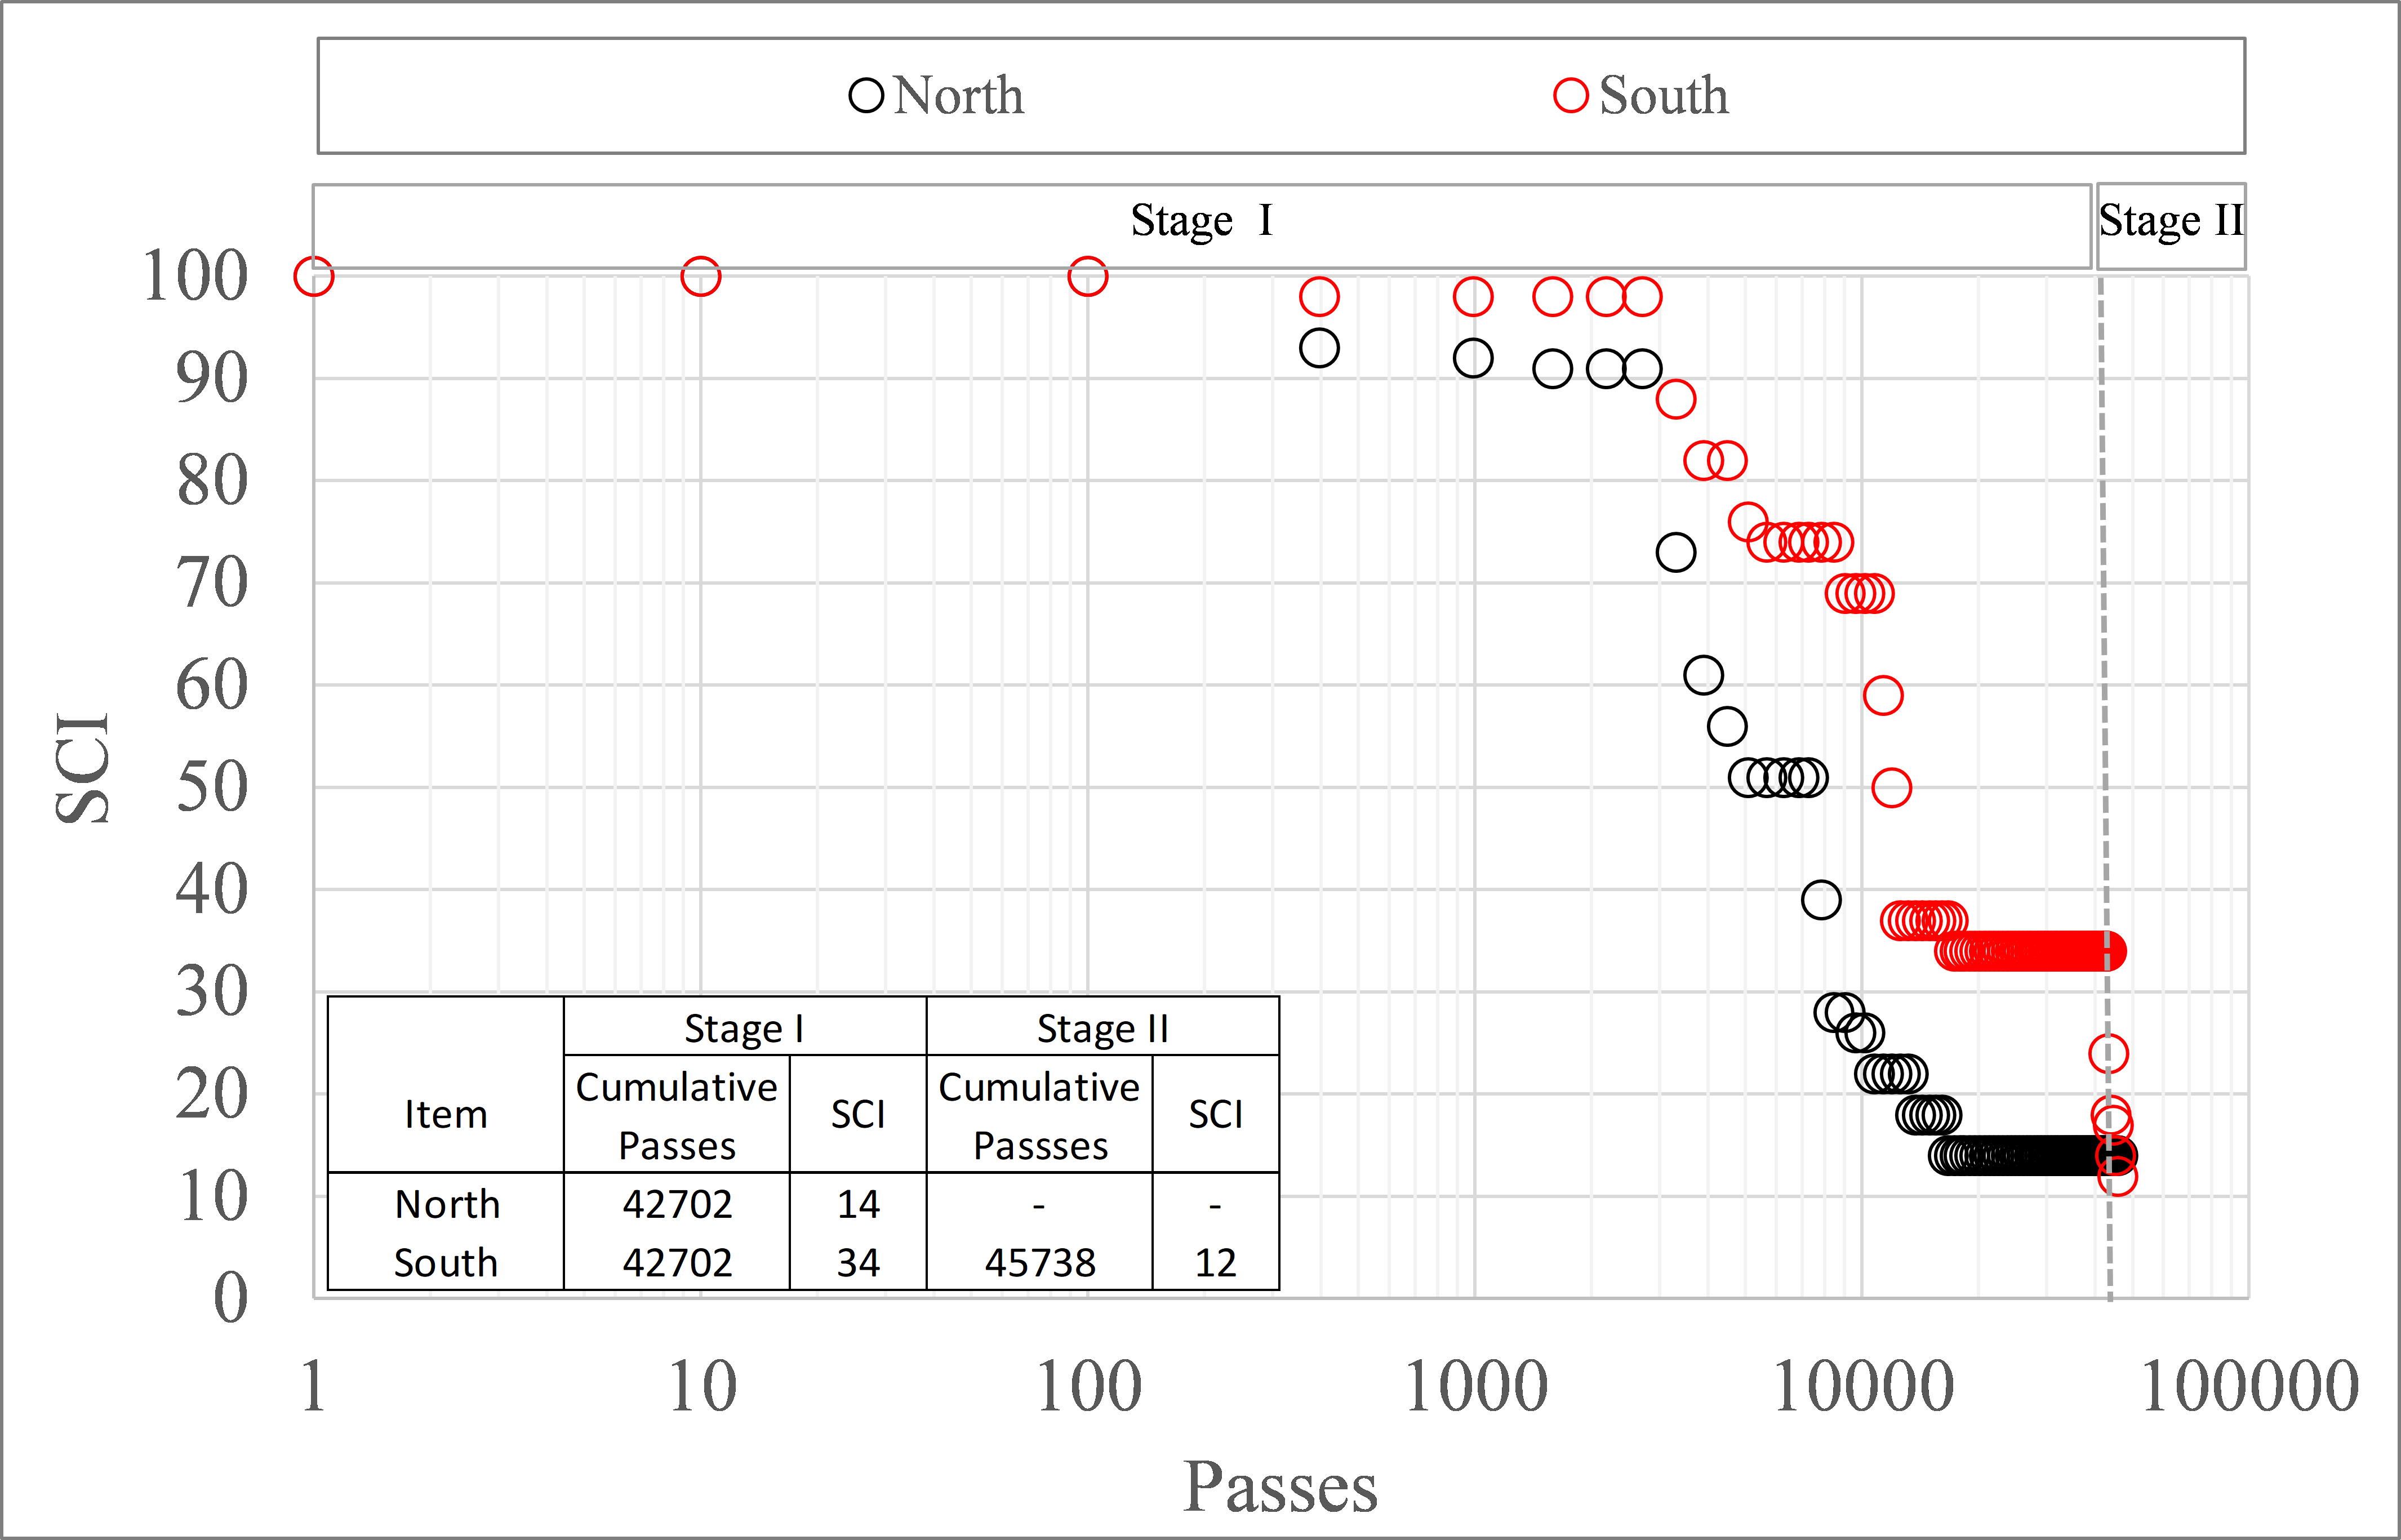
Joint Comparison SCI versus Passes Considering the North and South Sample Units (Click to zoom)
The test slabs were further divided into 4 subgroups. The four subgroups (North-West, South-West, North-East, and South-East) each represented a different combination of longitudinal and transverse joint types. Considering the likelihood of different deterioration trends in these four subgroups, SCI values were calculated treating each subgroup as a separate sample unit. The figure below shows the drop in SCI for the four subgroups over the course of trafficking. The North-East (NE) subgroup (undoweled transverse and doweled longitudinal joints), exhibited the poorest performance among the four subgroups, reaching the failure point (SCI=80) at approximately 3,000 passes. By contrast, the South-East (SE) subgroup (undoweled transverse and sinewave shaped longitudinal keyway joints) exhibited the best performance, requiring more than 16,000 passes to reach an SCI value below 80. After dropping to 79, the SCI of the SE subgroup remained constant throughout the rest of Traffic Test-Stage I. The North-West (NW) and South-West (SW) subgroups exhibited apparently similar performance. However, the narrow transition at the west end of the test area may have affected the performance of these two subgroups.
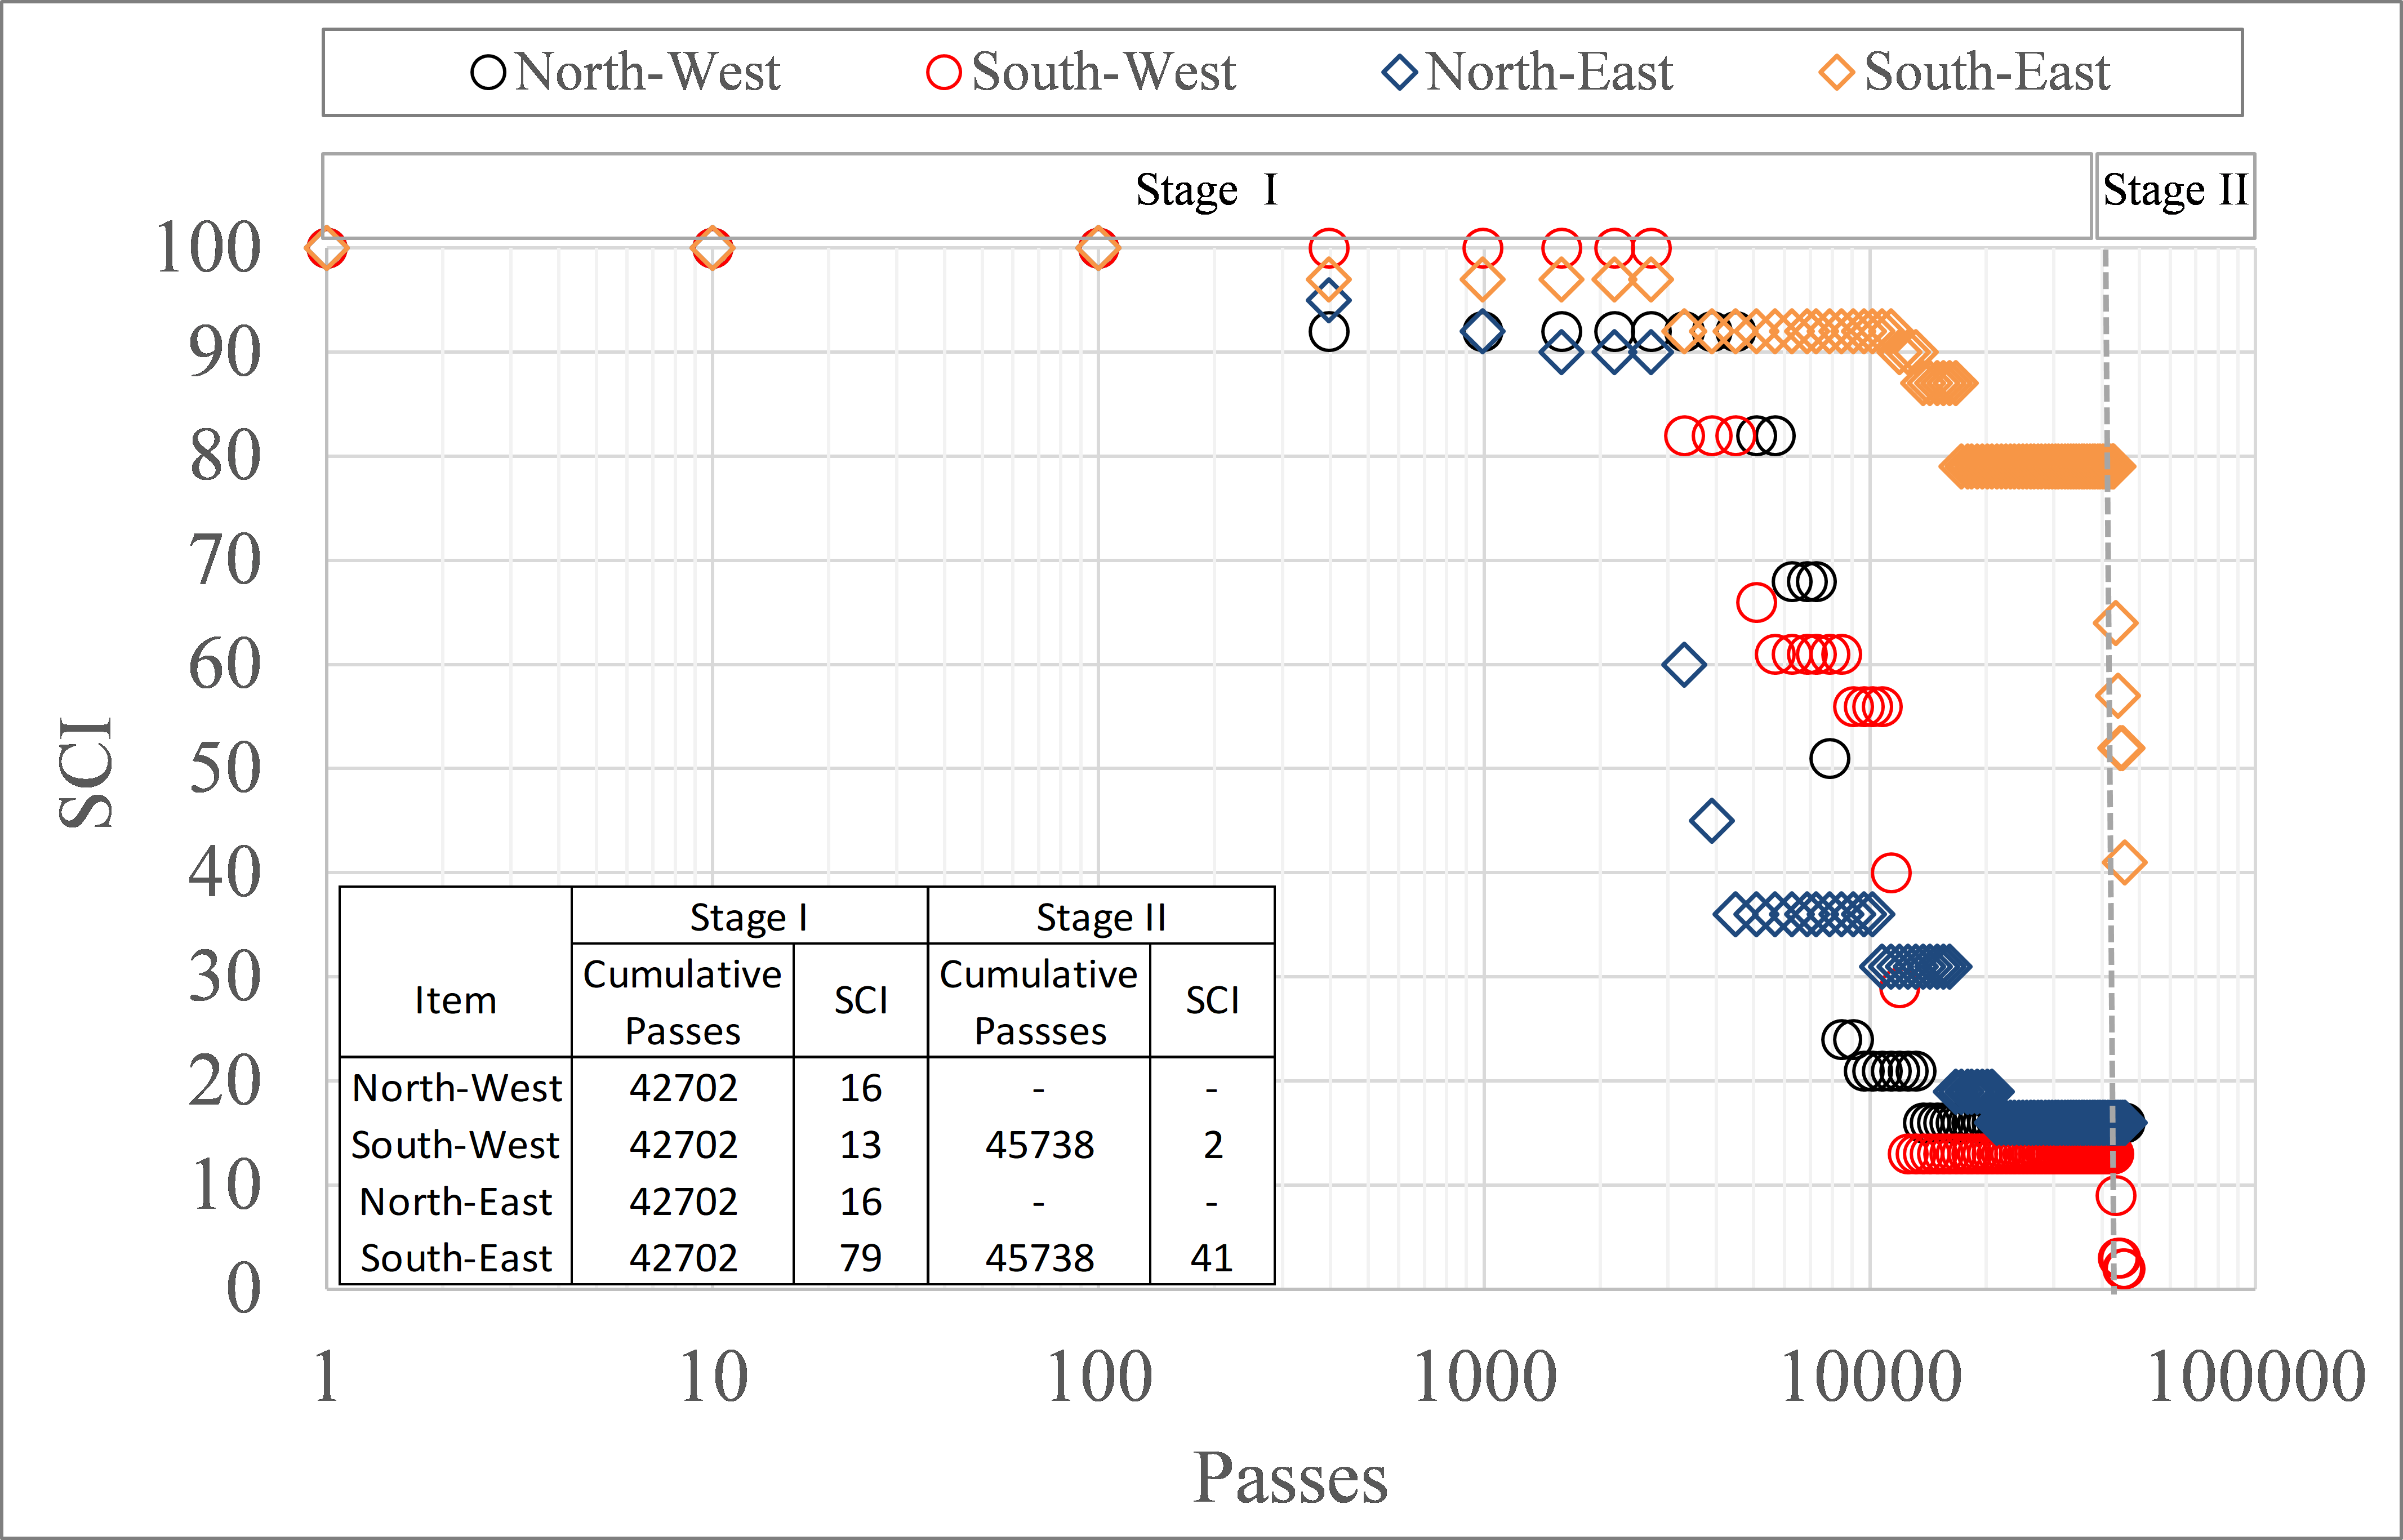
Joint Comparison SCI versus Passes Considering Four Sample Units (Click to zoom)
Slab Deterioration
Rigid Pavement Distress
Terminal SCI values for Stage I were: 16, 16, 13, and 79 for subgroups NW, NE, SW, and SE, respectively (see map below). Compared to the other subgroups, the terminal structural condition of the SE subgroup was significantly higher. In Stage II, heavy 3D gear loading increased the rate of SCI deterioration in both the SW and SE subgroups. The terminal SCI values for Stage II were 2 (SW) and 41 (SE).
In Stage I, corner breaks and all other major distresses on the NE subgroup were distributed over five of six slabs. On the SE subgroup, only one corner break occurred in slab J11S. In subgroups NW and SW, all major distresses were isolated to slabs J1N, J7N, J1S, and J7S, adjacent to the transition. At least some of the major damage observed in the NW and SW subgroups can be attributed to the influence of Transition 2 at the west end of the Phase 3 test pavement. If the slabs in question (J1N, J7N, J1S, and J7S) are removed from the analysis, then it is not possible to evaluate the relative benefit of keyed versus doweled joints based on slab condition, since the remaining slabs in both subgroups had minimal structural damage.
Stage II traffic accelerated the structural damage to the SW and SE subgroups. On the SE subgroup (undoweled), structural cracks extended to five of six slabs. Most of the damage on the SW subgroup (doweled) continued to be confined to slabs J1S and J7S adjacent to the transition, except for one new corner break in slab J9S. The latter corner break was on the east end of slab J9S, where the transition to the SE subgroup was undoweled. These observations confirm that the slab groups with doweled contraction joints generally exhibited better structural performance than those with undoweled contraction joints, especially under the heavy 3D gear loads.
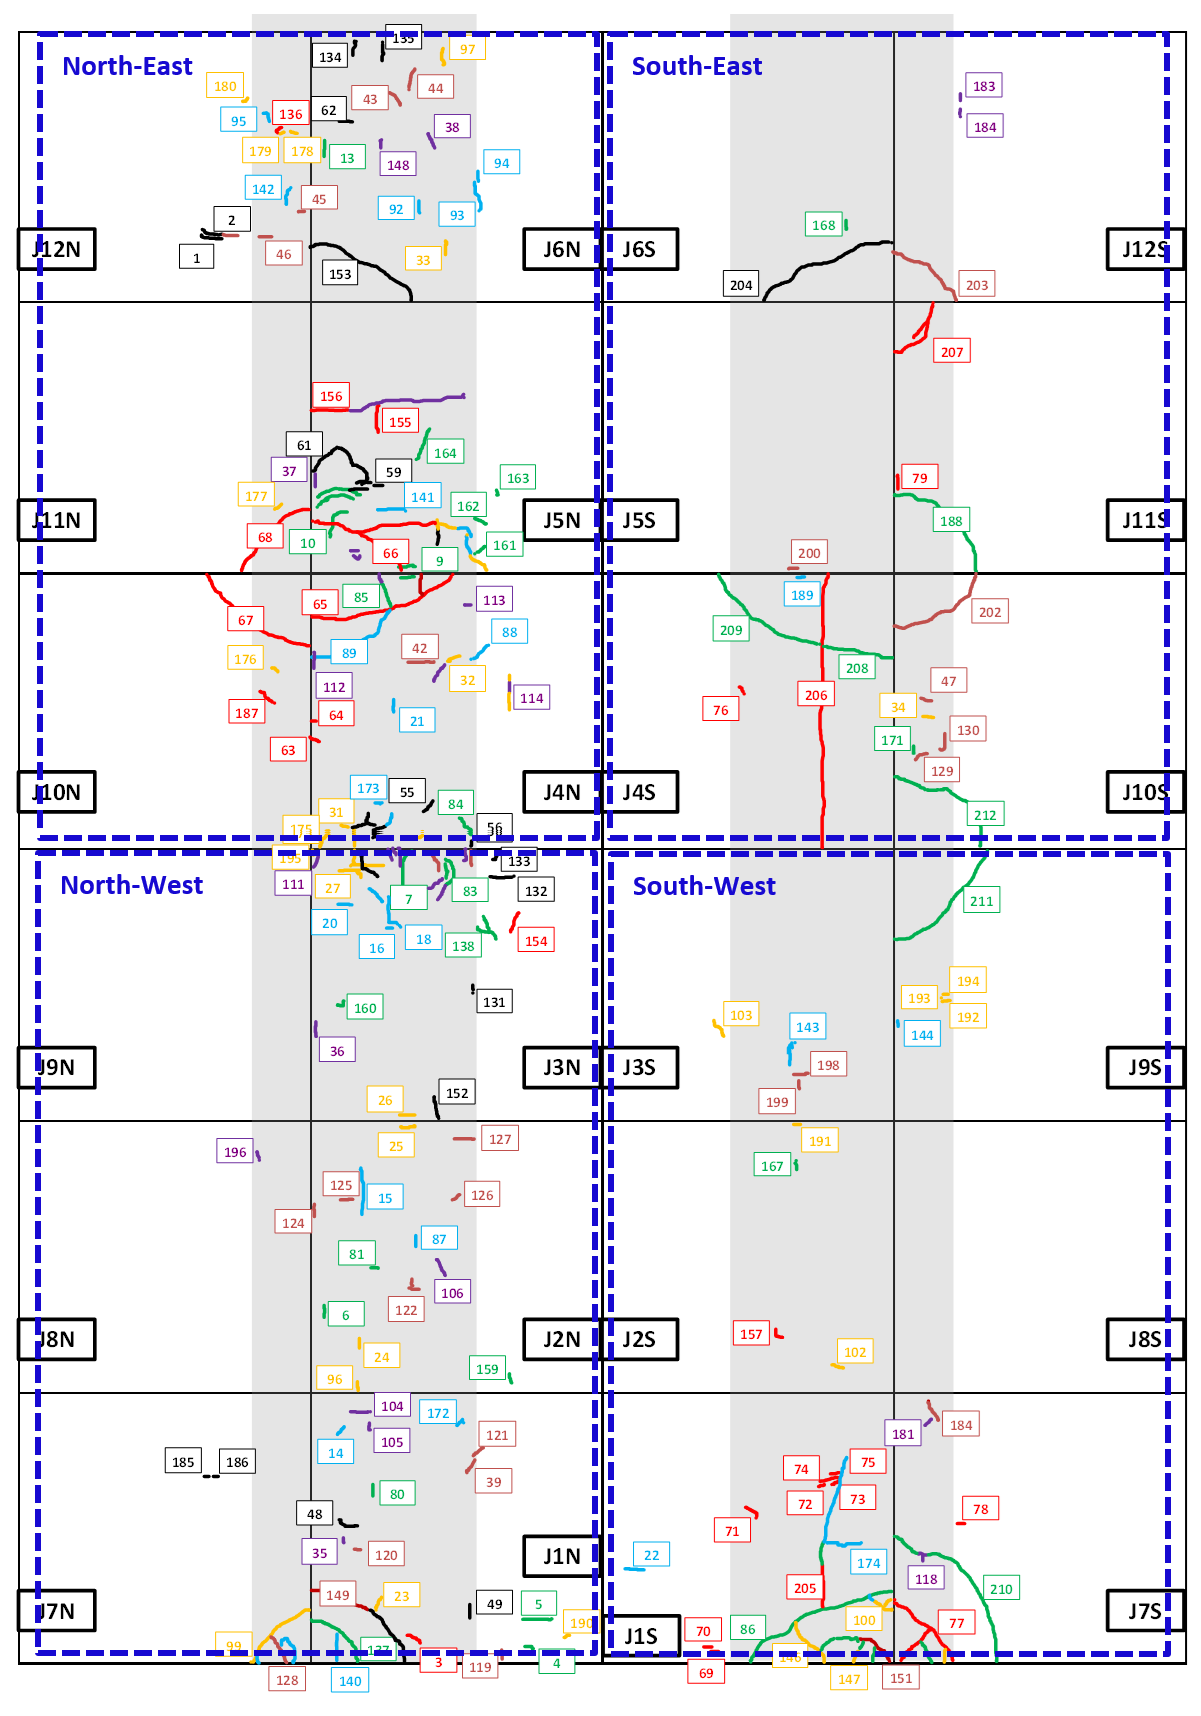
Distress Mapping at End of JCT Stage II (3D Gear at 70,000 lb. Wheel Load) (Click to zoom)
Conclusions
Pavement Structural Performance
- Corner breaks were the major structural distress type for the Joint Comparison Test. Most corner breaks developed at undoweled contraction joints.
- The NE slab subgroup (combination of undoweled contraction and doweled construction joints) exhibited the poorest structural performance among all slab groups.
- As measured by fatigue life, the SE slab subgroup (combination of undoweled contraction and sinusoidal keyed construction joints) outperformed the other three subgroups.
- Neither of the two tested construction joint types (sinusoidal keyed or doweled) demonstrated a clear structural performance advantage over the other.
Relation between Pavement Condition and Joint Performance
- Doweled contraction joints exhibited no significant change in load transfer capacity over the course of the traffic test. An increase in apparent load transfer capacity for undoweled contraction joints was associated with enhanced aggregate interlock due to changes in slab temperature.
- Doweled and sinusoidal keyed longitudinal keyed construction joints exhibited generally equivalent performance. The load transfer capacity of both doweled and keyed construction joints degraded over the course of traffic. Doweled construction joints exhibited somewhat slower rates of deterioration and higher terminal LTEδ values than did sinusoidal keyed joints.
- Subgroups with doweled contraction joints (NW and SW) exhibited generally better performance than the subgroups with dummy joints (NE and SE). Within the former subgroup, it was not possible to determine which of the two tested joint combinations – doweled contraction/doweled construction or doweled contraction/keyed construction - performed better.
- No definite correlation could be established between the performance of contraction joints and pavement structural condition (SCI). Doweled contraction joints can sustain good performance at SCI values less than 80. The performance of undoweled contraction joints was most sensitive to slab temperature, regardless of pavement condition.
- In contrast to contraction joints, construction joint performance degraded with SCI, but at a slow rate.
Design Considerations
- CC8 test data indicated that load transfer was 30% or above for doweled contraction joints, doweled, and sinusoidal keyed construction joints. This observation is significant because a 25% edge stress transfer is currently assumed in the FAA design. Undoweled contraction joints were more variable and exhibited edge stress transfer values less than 20% at low slab temperatures.
- It is possible to estimate in-situ edge stress transfer from HWD deflection data. Deflection-based LTEδ was found to be reasonably well-correlated to stress-based LT𝜎 for contraction joints.
- Correlations between LTEδ and kj for both contraction and construction joints show that above LTEδ = 90% there is little variation of LTEδ with respect to increases in joint stiffness. The 90% LTEδ threshold value corresponds approximately to kj = 150,000 lbs./in/in.
- Existing correlations in the literature between deflection-based LTEδ and kj were reformulated to develop a new stress-based LTσ - kj correlation. The proposed correlation has potential to be implemented in the future rigid pavement design procedure.
Additional Resources
To be directed to the CC8 Phase 3 Comparison Test Database, click here.
To download the CC8 Phase 3 Joint Comparison Traffic Test Report, click here.
Return to Construction Cycle 8 Overview