Nondestructive Testing (NDT)
Heavy Weight Deflectometer (HWD) & Rut Depth Testing
A KUAB Model 240 Heavy Weight Deflectometer (HWD) was utilized before and during CC1 trafficking. The KUAB operates on the principle of dropping weights on a series of hard, rubber buffers separated by a second series of weights and buffers which are connected to a loading plate resting on the pavement surface.
The objective of utilizing the HWD was to:
- Verify the uniformity of the pavement construction, particularly subgrade strength prior to traffic testing;
- And to monitor the pavement structural degradation with traffic and time on all flexible test items.
In addition, the progress of rut depth accumulation during trafficking was monitored using a TSP measuring equipment and a physical straightedge. The MDD sensors embedded within the test pavements also were used to monitor the permanent deformations.
For information on the NDT Testing on the CC1 Experiment click on the links in the table below.
Data Collection
Uniformity
Initial HWD data collection took place on June 14 and 15, 1999. Engineering and Research International Inc. (ERI) of Savoy, IL, performed a series of Falling Weight Deflectometer (FWD) tests using a KUAB Model 150 FWD with a 12 inch (30.5 cm) load plate and a pulse width of approximately 27 msec.
The Model 150 unit was used because at the time the FAA was still awaiting delivery of the larger Model 240 unit. Tests were performed at nominal load amplitudes of 9,000 lbs. (40 kN), 13,500 lbs. (60 kN), 18,500 lbs. (82 kN) and 25,900 lbs. (115 kN) on a 10 ft. grid within each of the test items. The FWD loading points included slab centers, corners, transverse and longitudinal joints. The Model 240 HWD was used for all subsequent Non Destructive Testing (NDT) starting from October 1999.
For CC1 tests on rigid test items, one sensor was positioned at the center of the load plate (D0), and another sensor was positioned 12 inches in front of the plate along the path of the vehicle (D-1). This allows the HWD unit to be positioned such that the D-1 sensor is on the opposite side of a joint from the load plate to evaluate the load transfer efficiency.
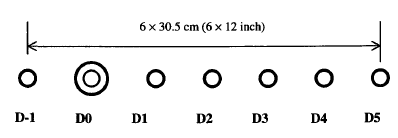
Location of the HWD Deflection Sensors (Click to Zoom)
The HWD test plan consisted of four drop heights, a 36 kips (160 kN) seating drop followed by impact loads of 12, 24, and 36 kips (53, 106, and 160 kN). The first 36 kips (160 kN) drop seats the pavement by settling out the residual permanent deformations within the pavement structure and is discarded in the analysis. The peak loads and deflections were recorded for all four drops along with air and pavement surface temperatures.
Trafficking
HWD tests were conducted on all flexible test. Tests were performed on the non-trafficked centerline (C/L), 6-wheel traffic lane (north), and 4-wheel traffic lane (south) at 10 ft. (3.05 m) offsets, as illustrated in the figure below. Deflection basins were characterized by measuring deflections at the center of the load plate (D0) and at 12, 24, 36, 48 and 60 inch offsets (D1, D2, D3, D4, and D5).
The effect of traffic on the pavement structure was evaluated by comparing the HWD deflection data for trafficked and non-trafficked (center lane) areas. A comparison between D0 and D5 values between the six flexible test items was also performed.
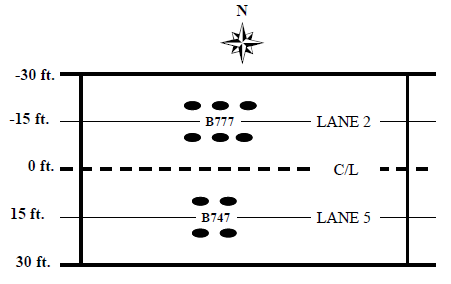
Location of HWD Test Lanes Results (Click to Zoom)
Rut Depth Evaluation
TSP measurements were made with a manually propelled inertial profiling device (CSC Profilair Profilite 300). Measurements were made at two longitudinal lines at the one-third points along the test items about 6 inches to the west of the MDDs perpendicular to the traffic direction. Profile elevations were recorded every 9.84 inches (250 mm) with an estimated speed of 1.2 mph (2 km/h) along the transverse lines.
Concurrent with TSP measurements rut depth was measured with a 12 ft. (3.6 m) and later with a 16 ft. (4.9 m) long straightedge. The recorded rut depth was the maximum deviation of the pavement surface from the straightedge.
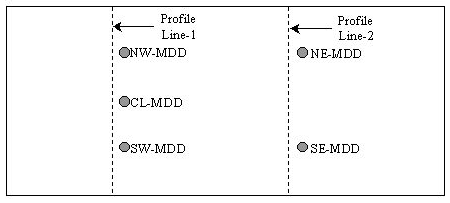
Profile Line Locations (Click to Zoom)
Results
Rigid Pavement
Deflections
The table below summarizes the FWD test results for the rigid pavement test items at the center of slabs (deflection basin tests). An analysis was performed on the D0 and D5 measurements at the center of the slabs for test items LRS, MRS, and HRS. D0 is an indicator of the overall stiffness of the pavement structure and D5 is an indicator of subgrade stiffness. They concluded that within each test item, the layer stiffness was uniform.
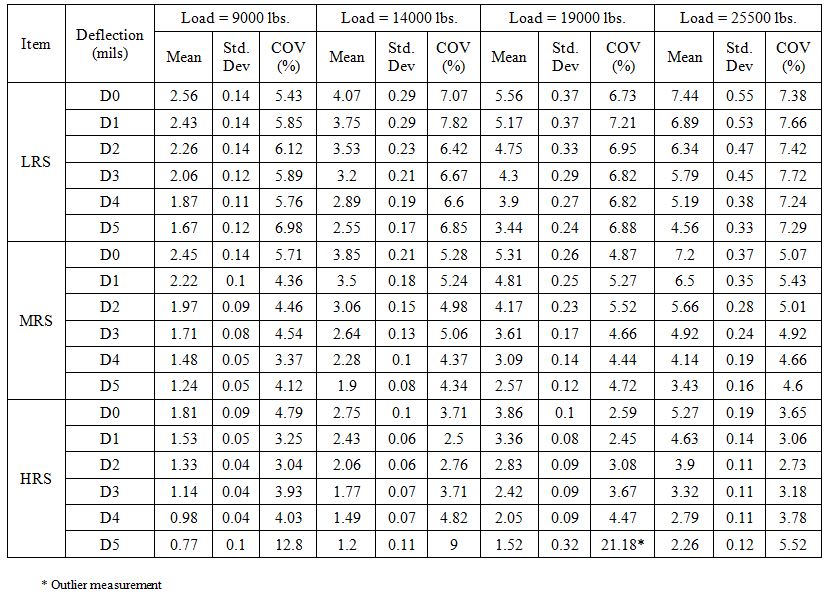
Summary of FWD Basin Tests on Rigid Pavement Test Items (Click to Zoom)
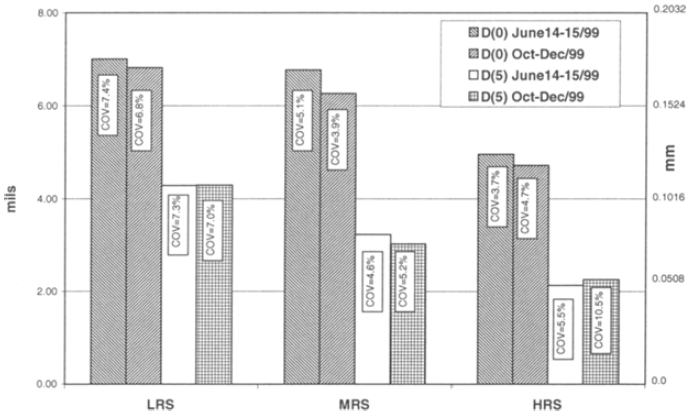
The figure below compares peak deflections D0 and D5 for the three rigid test items. The rigid pavement test items on the low and medium strength subgrades showed similar D0 deflection responses. The rigid pavement test items on the high strength subgrade showed lower D0 deflections compared to LRS and MRS. Results from the D5 measurements also showed that the three subgrade types have significantly different stiffnesses.
Comparison of FWD Deflections D0 and D5 at Center of Slab for the Rigid Test Items (Click to Zoom)
The mean of the measured deflections under the plate load (D0) and at 60 inches (D5) at the center of slabs are presented in the figure below. The average D0 and D5 deflections were higher in the LRS sections with low strength subgrade. The average deflections from the June and October testing were relatively uniform within each test item.
Deflections D0 at the joints and corners for LRS, MRS and HRS test items were also evaluated. The mean values of D0 at the joints and corners for LRS, MRS and HRS test sections are displayed in the figure below.
Average Deflections D0 and D5 at the Center of the Slabs (Click to Zoom)
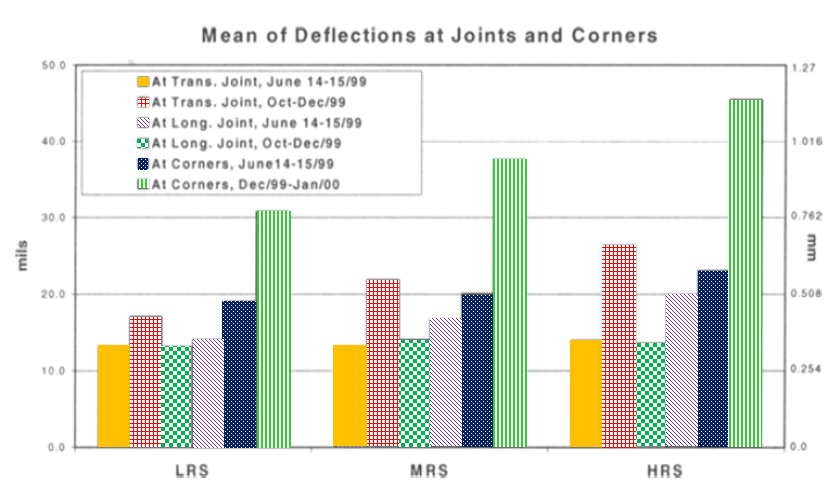
Deflection D0 at the Joints and Corners (Load = 24,000 lbs.) (Click to Zoom)
Joint Transfer Efficiency
The tables below show the calculated Joint load transfer efficiency (LTEδ), values for longitudinal and transverse joints, based on the 24 kip drops.
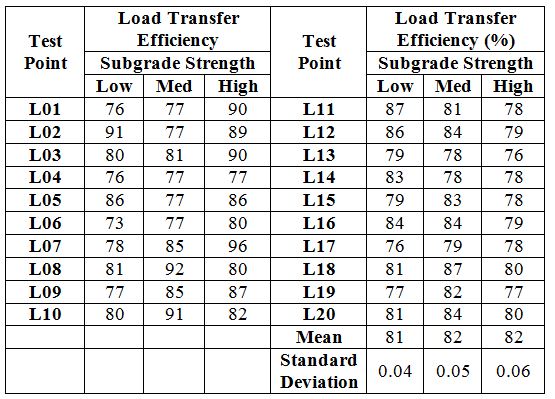
Load Transfer Efficiency for NAPTF Longitudinal Joints (Doweled Joints) (Click to Zoom)
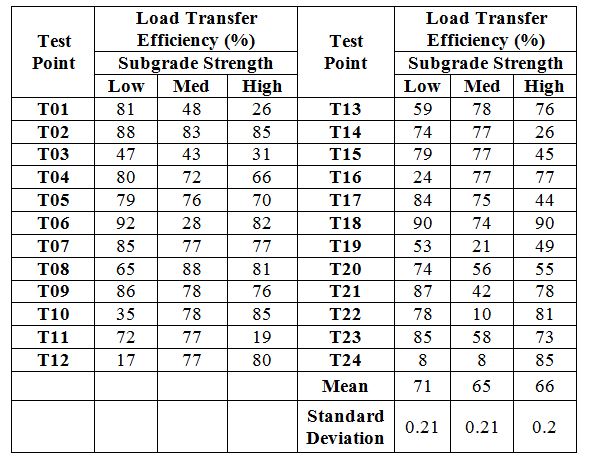
Load Transfer Efficiency for NAPTF Transverse Joints (Dummy Joints) (Click to Zoom)
Flexible Pavement
Uniformity
The table below summarizes the mean, standard deviation, and coefficient of variation (COV) for D0 and D5 measured on the flexible test items. Test items LFS and MFS showed lower COV values for D0 compared to LFC and MFC respectively. The COV values for D5 ranged from 1.4 to 5.5 %.
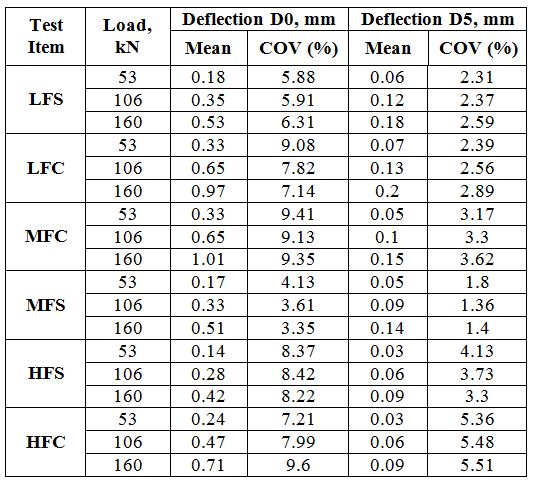
Summary of Uniformity Tests on Flexible Pavements at the NAPTF (Click to Zoom)
Trafficking
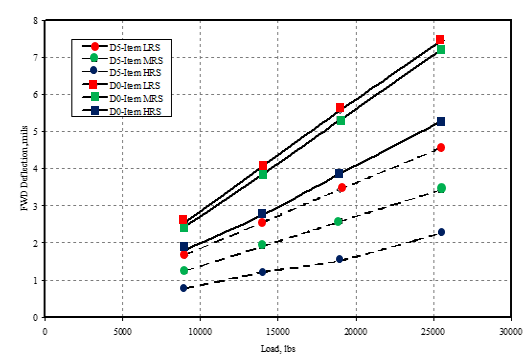
The figures below illustrate the D0 and D5 values at different load levels for the six flexible test items.
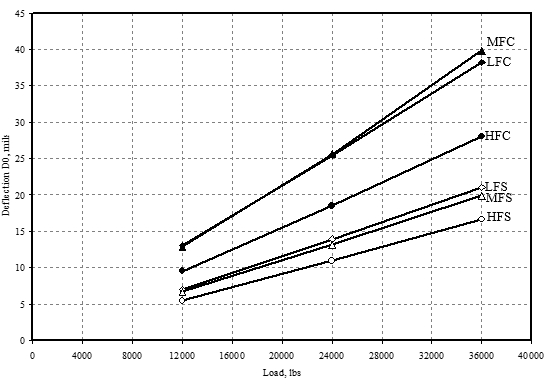
Comparison of Average Deflections D0 for Flexible Test Items (Click to Zoom)
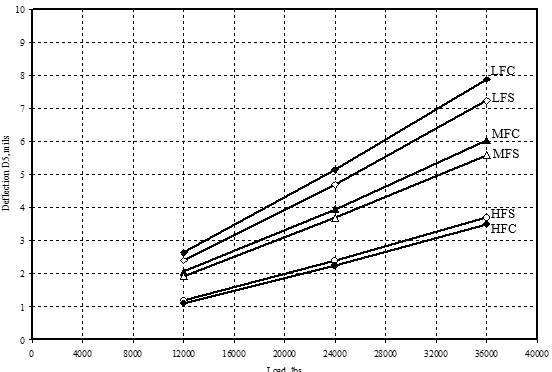
Comparison of Average Deflections D5 for Flexible Test Items (Click to Zoom)
Rut Depth Evaluation
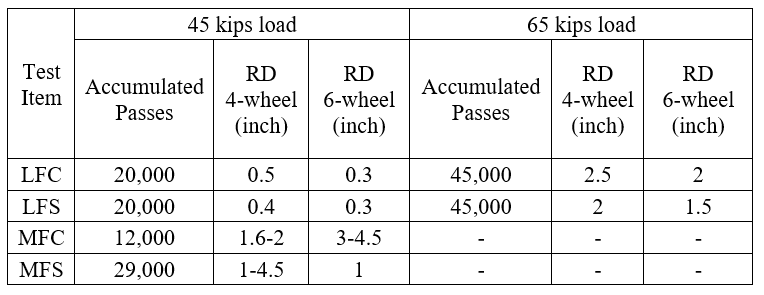
The table below presents the TSP rut depths. Rutting rates in test items with conventional base were higher compared to test items with stabilized base. The rut depths under 4-wheel loads were higher than those from the corresponding 6-wheel loads. For both LFC and LFS test items, the rate of rut depth accumulation before 20,000 passes was very low increased significantly after the wheel load was increased to 65,000 lbs. (29.4 tonnes).
Conclusions
Based on the results of the CC1 Experiment, the key finds were:
- The HWD data collected prior to trafficking indicated significant increase of curling in the slabs from summer to the winter of 1999.
- Test items on low and medium strength subgrades showed similar deflection responses and pavements on high strength subgrade showed lower deflections.
- The deflections of transverse joints were higher than the longitudinal joints due to lower LTE of the dummy joints.
- The average deflection values for winter and summer were fairly compatible within each test item.
- Average deflection values for longitudinal and transverse joints as well as corners, were higher in the winter testing compared to summer due to the higher upward curling in winter time.
- Comparing the joint LTE for low, medium and high strength subgrades, no significant influence of subgrade CBR was observed for dowelled joints. Slabs on higher strength subgrade test items showed more curling compared to the lower strength subgrade test items in dummy joints.
- Deflections (D0 values) were relatively uniform indicating that pavement structure was uniform within each test item.
- The ratio of the central deflection D0 for the fourth drop in the HWD sequence to the seating drop decreased as the pavement structure progressed towards failure.
- In general, the maximum rut depth at failure was higher for conventional base flexible test items than for stabilized base flexible test items.
- The number of passes required to reach the 1-inch rut depth was similar for the 4-wheel and 6-wheel gears.
- In test item LFC, initially the subbase layer contributed the most to the pavement deformation.
- In test item LFS, the P-209 base layer contributed the most to the pavement deformation in initial passes.
- For test item MFC, in both 6-wheel and 4-wheel loading, the permanent deformation was dominated by the subgrade contribution up to about 5000 passes.
- For MFS test item, all the layers contributed to rutting and the overall rutting level was temperature dependent.
- In test item HFC, subgrade contributed the most to the overall rutting, but overall levels of rutting were very small.
Return to Construction Cycle 1 Overview