CC2 Single Slab Material Testing Report
Determination of the Initial Shape of a Curled Slab
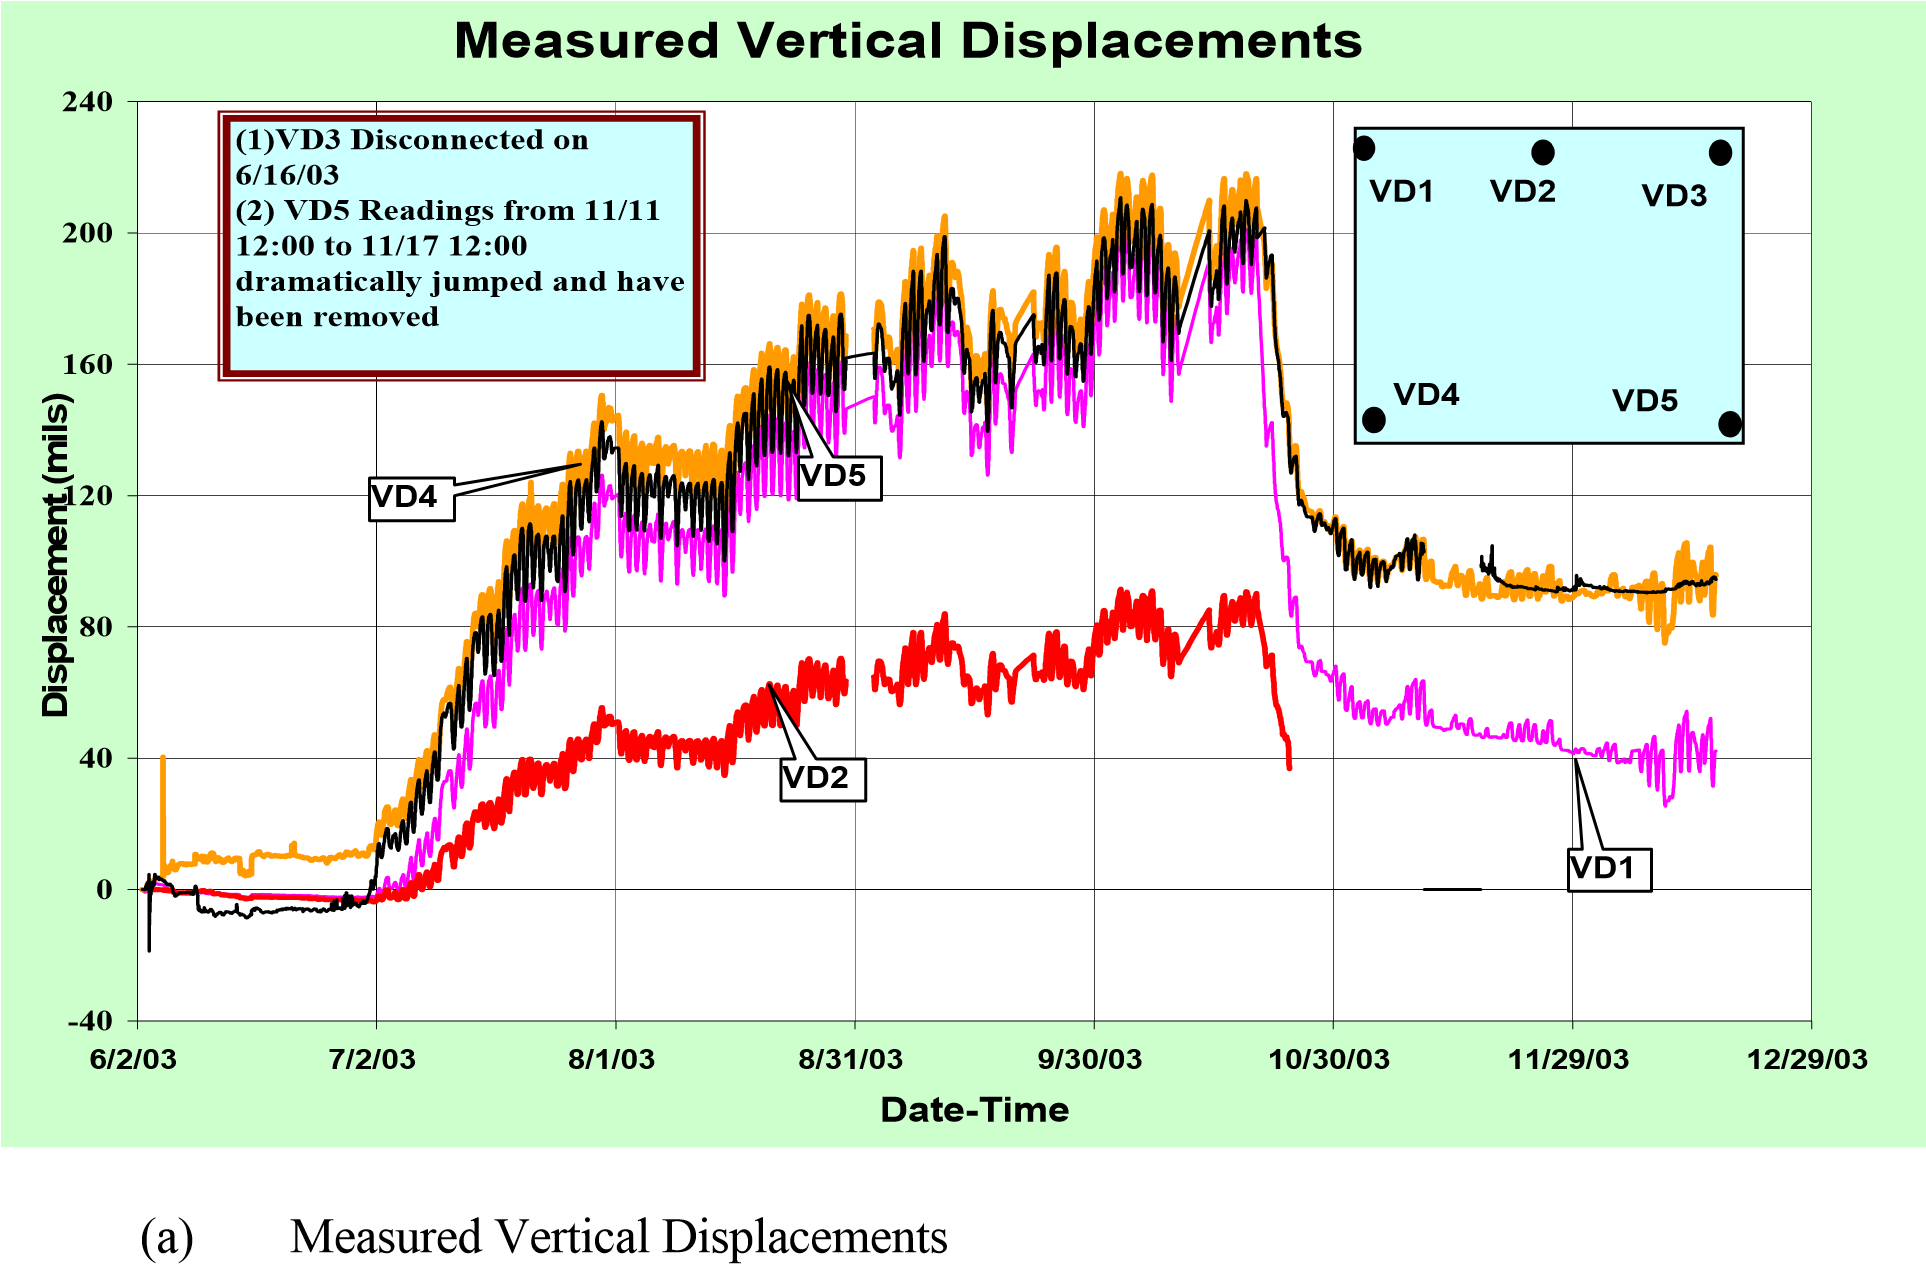
Temperature and moisture variations are two major factors causing the slab in-plane and out of plane movements. The slab in-plane movements are responsible for the joint formation and opening width variation. The out-of-plane slab movements lead to the slab shape variation – not only from winter to summer, but also from day to night. Vertical displacement sensors were installed at the slab corners and one edge, as shown in Figure 1. More than six months of corner displacements (VD1, VD4 and VD5) and edge displacement (VD2) are presented in Figure 2(a). The sensor VD3 did not work well, so it was disconnected on June 16, 2003. The three corner displacements were relatively close to each other, and the maximum values were between 190 to 210 mils (4.82 to 5.33 mm) achieved the morning of October 20, 2003 shortly before the first loading test was conducted.
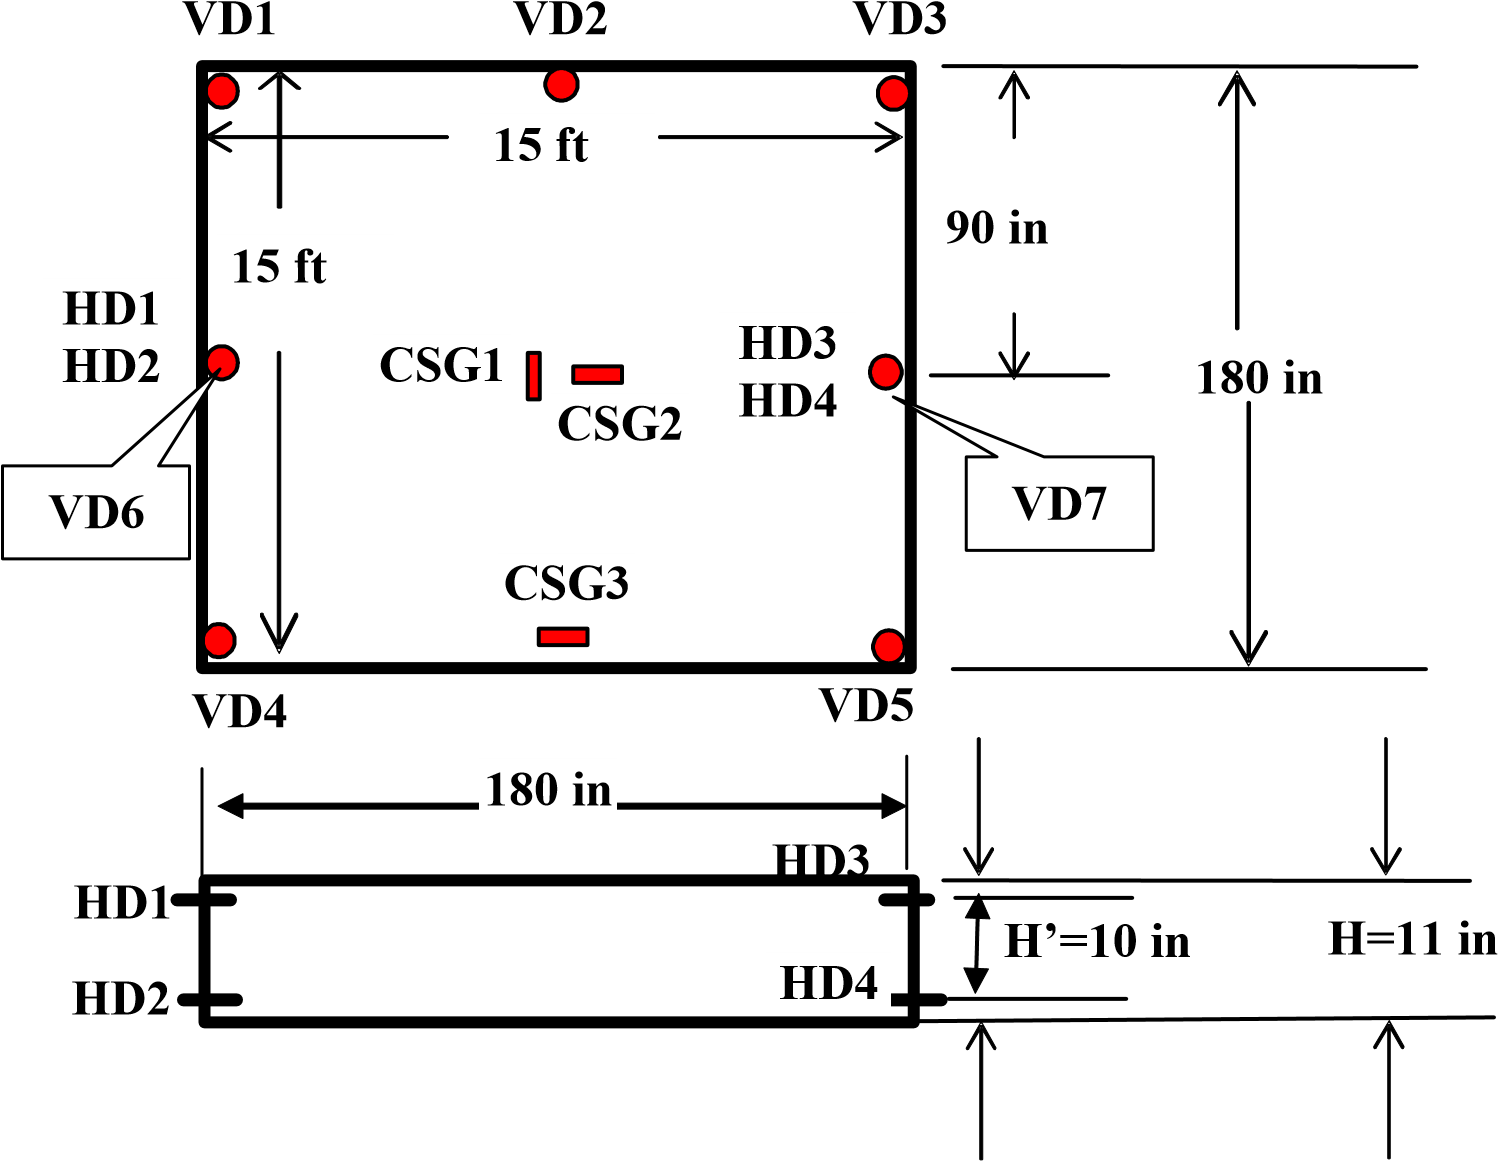
Figure 1. Plane View of the Test Slab and the Sensor Locations (VD6 and 7 were added on December 5, 2003, and VD3 was disconnected on June 16, 2003)
The initial shape of a slab must be clearly defined in order to calculate the load induced responses for a curled slab. Therefore, it is necessary to find a way to define the initial shape. When the temperature of the slab at the surface is lower than that at the bottom, or when the relative humidity of the concrete near the slab surface is lower than that near the slab bottom, the upper portion of the slab shrinks and the lower portion expands. This leads to the four corners of the slab curling upward. If the temperature and relative humidity distribution along the slab depth are opposite (top temperature or the relative humidity are higher than the bottom), the four corners of the slab curl downward. Though the curling can be predicted by a 3D finite element program, if sufficient temperature and moisture information are available, it is still a very difficult task. First, the distributions along the slab depth are nonlinear rather than linear, and they vary continuously. Second, the distributions in the slab plane are different, more or less, at the slab corner, edge and interior points. Third, though temperature and moisture sensors were installed at two locations, four sensors through the depth of the slab at each location, it is still not enough to define the detailed three dimensional distributions of the temperature and relative humidity.
(b) Corner and Edge Vertical Displacements Predicted by Different Models
Figure 2. Initial Slab Shape Defined by ETG
If the slab is under an environment with temperature variation only (moisture and other effects are assumed negligible), and the temperature distribution along the slab depth is linear, the gradient of the temperature (ETG) may be written in ºF /inch (ºC/cm) as:
(ETG = Temperature at slab top - Temperature at slab bottom)/(Slab thickness) (1)
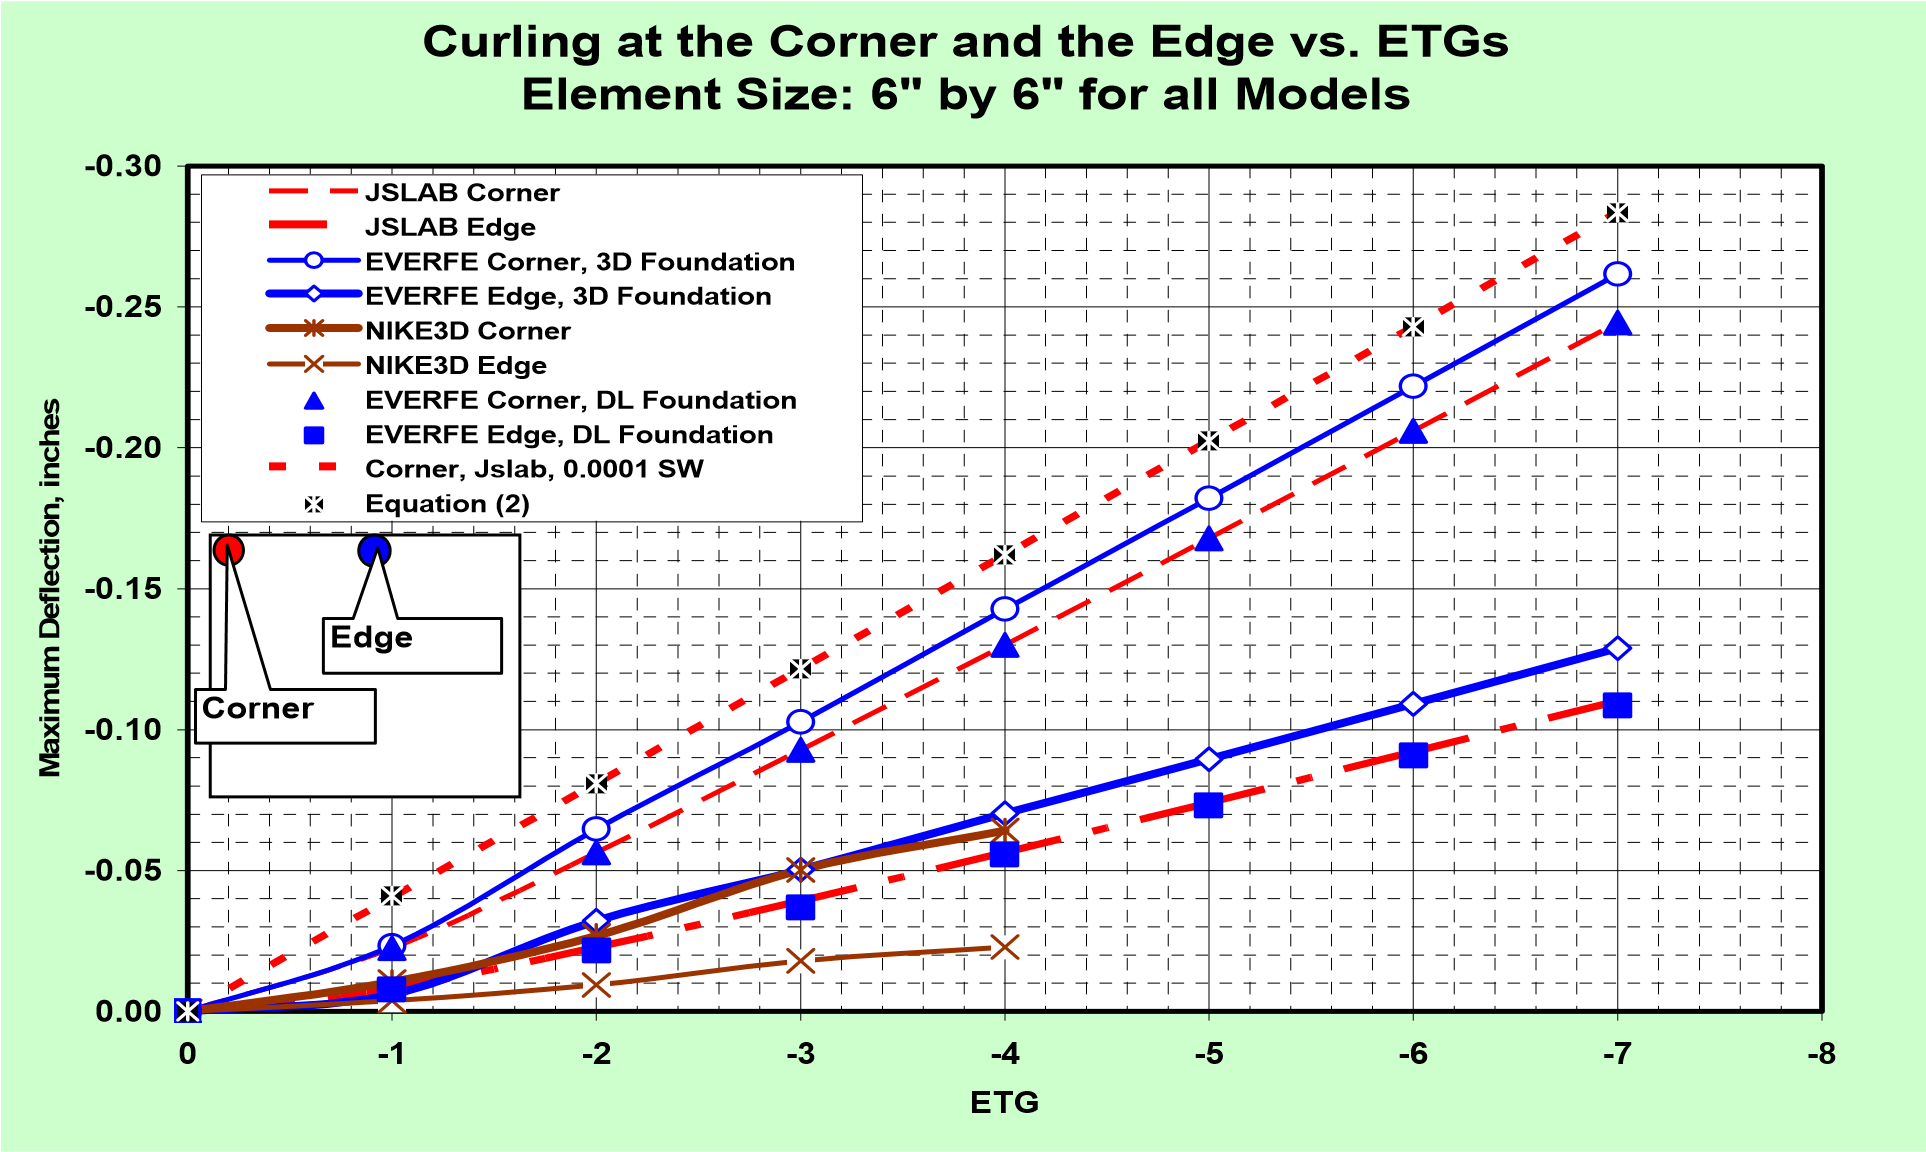
With a value of ETG given, later it is defined as “Equivalent Temperature Gradient” to represent all effects to cause the slab curling [8], the vertical displacements at the corner and edge may be easily calculated. Figure 2(b) shows the results calculated by the following five models:
(1) Nike3D program [9];
(2) EverFe program using dense liquid (DL) foundation [12];
(3) EverFe program using multiple layer foundation(ML) [12];
(4) Jslab2002 program using DL foundation [7]; (5)
(5) Simplified equations (2 & 3) below [11]:
∆Corner =(ETG*α*L2)/4 (2)
∆Edge =(ETG*α*L2)/8 (3)
Where ETG can be obtained by Equation (1), α is the thermal coefficient of concrete, L is the slab width or length, see Figure 3. Equations (2 & 3) were obtained by assuming the slab is curled in such a way that the slab becomes a portion of a circular shell with radius R. For a high ETG, R is small. For a low ETG, R is large. For an uncurled (flat) slab, R is infinitely large. Therefore, the curling at the corner (ΔCorner) and edge (ΔEdge) can be determined simply by geometrical relations, and the effects of the slab self-weight have been neglected.
Findings in Figure 2(b) are summarized as follows:
(1) All models predict higher curling for higher ETG;
(2) Results by using model (2) and (4) (E of concrete = 6,000,000 psi, and k of foundation = 600 pci) are almost identical, which indicates that the 2D thin plate elements and the 3D solid elements perform almost the same for the slab in curling displacement analysis under environmental variation. More numerical examples show that the curling is not sensitive to the input values E and k. The numerical results implicitly support the assumption used by Equations (2 & 3) in which the curling is independent of the values of E and k.
(3) The interface boundary conditions between the slab and foundation have been defined as frictionless – shear stress always equals zero, and the vertical displacements at the slab bottom always equal those at the foundation top at the same point when they are in contact, and the slab bottom can freely separate from the foundation top. However, it has been found in the results using Nike3D that a tensile stress could develop between the slab bottom and the foundation top when they are separated. This leads to the curling predicted by Nike3D being significantly smaller than that predicted by EverFe even if all input data for model (1) (Nike3D) and (3) (EverFe) are the same. The above phenomenon was found only when the slab bottom was separated from the base top. Further study is needed to solve the problem and make the Nike3D program workable for the curling analysis.
(4) The curling predicted by the complete 3D models in the EverFe program (both slab and foundation layers are modeled by solid elements with 27 nodes) is only slightly larger than those predicted by model (2) (3D model for slab and dense liquid for foundation) and model (4) (thin plate for slab and dense liquid for foundation).
(5) When the input for the self-weight is set as 1/10,000 of the true value, the results predicted by Jsla2002 are almost identical to those predicted by the simple geometrical equations (2). The entire curling process may be approximately divided into two steps:
a The flat slab shape is changed by shrinkage and expansion of the concrete due to thermal effects defined by ETG. The curling of slab in this step should be predicted well by geometric equations (2) and (3);
b The curled slab as a portion of a circular shell, is pulled down by the slab self-weight which reduces the curling and changes the circular shell into a different shape as it is under the combined effects of ETG and the slab self-weight. Therefore, the differences between results from models (2, 3, 4) and (5) show the effects of self-weight of the concrete during the slab curling;
(6) Equations (2) and (3) provide good approximations for slab curling. They can also be used to evaluate the reliability of any 3D or 2D programs which are used for curling analysis. When the self-weight is set close to zero in any 2D or 3D program, the results should be almost identical to those calculated by equations (2) and (3).
Figure 2(b) indicates that the initial slab shape may be expressed by a single parameter ETG which is defined as the Equivalent Temperature Gradient (ETG) used to represent all environmental effects on the slab shape, including moisture change. For example, since the measured vertical displacements in the Morning of October 20, 2003 were between 190 to 210 mils, a slab shape due to ETG = -6.0 ºF/in may be defined as the approximate initial shape if the program Jslab2002 is used, ETG = -5.5 ºF/in may be defined as the initial shape if the program EverFe is used. Similarly, the average corner curling displacement measured in the morning of December 5, was 79 mils. Therefore, the initial shape at that time has been defined as a slab shape under an ETG between -2 to -3 ºF/in. In this paper, the initial shapes are defined as the slab shape due to an ETG = - 6.0 ºF/in and an ETG = -5.5 ºF/in for the tests conducted on October 20, 2003 when programs Jslab2002 and EverFe are used to do the analysis respectively. And, the slab shape due to an ETG = -3 ºF/in for the tests conducted on December 5, 2003, and ETG = -2 ºF/in for the tests conducted on January 9, 2004 for both programs.
Curling Dispalcements and Interior Strain Responses When the Slab Reached its Highest Curling on October 20, 2003
On October 20, 2003, the slab had been under a one month wet curing period (the slab was covered by burlap and watered routinely) plus 110 days natural drying period (the burlaps was removed and the surface was exposed to the indoor environment.) Figure 2(a) indicates that the slab kept flat until the end of the wet curing period. Then both corner and edge curling displacements were measured, and the slab received the maximum curling at the end of September after drying for about three months. The first static load tests were conducted on October 20, 2003. Four corner curling displacements were also measured by using a feeler gage, a simple tool available in hardware store. It has many pieces of thin steel sheets with different thickness. The thinnest one is 0.005 inches. The feeler gage results were 200, slightly higher than 200 (the capability of the feeler gage is 200 mils), 189 and 187 mils at the VD1, VD3, VD4 and VD5 locations respectively, shown in Figure 1. These results match the readings from VD1, DV4 and DV5 very well in Figure 2(a).
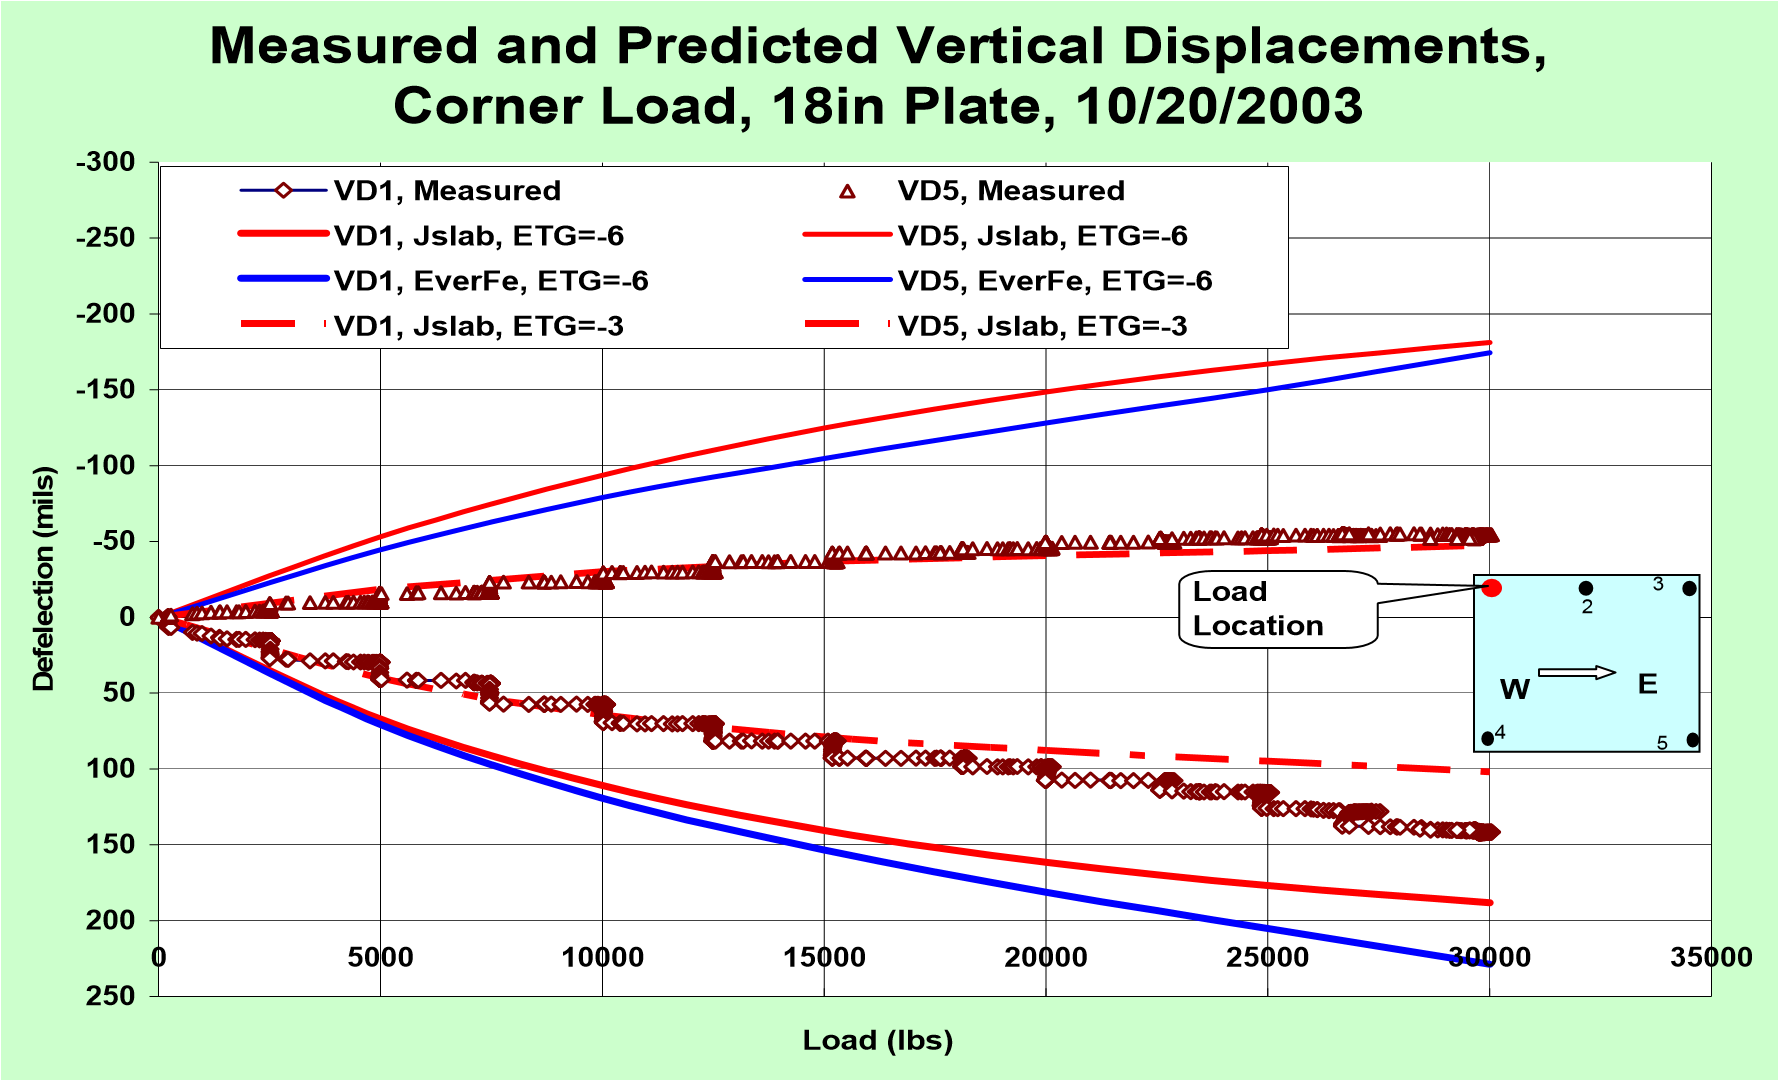
An eighteen inch plate was placed at the north-west corner. The load on the plate was increased from 0 to 30,000 lbs in 5,000 lb increments. Since the plate load test conducted on the surface of econocrete layer were 475 and 514 pci, the comprehensive k value on the surface of existing 9.75 inches slab was selected as 600 pci for analysis. For all cases, the E value of the slab was 6,000,000 psi as obtained by the Lab tests.
The predicted and measured curling displacements VD1 and VD5 are presented in Figure 3(a).
All measured data and the results predicted by the 2D and 3D models show rocking of the slab; the VD1 corner was pushed down and the VD5 corner was lifted up. Both models significantly overestimate the rocking actions by using ETG=-6 ºF/in for Jslab2002 and ETG=-5.5 ºF/in for EverFe to define the initial slab shape. However, when ETG = -3 ºF/in was used in the calculation, the predicted VD1 and VD5 were close to the measured ones.
The predicted and measured strains at CSG2, 1.5 in from the slab top and defined as “upper”, in the middle of the slab and 1.5 in from the slab bottom and defined as “lower” in this paper, are shown in Figure 3(b). The strains are calculated by the following strain-stress relationship equation:
εX =  (4)
(4)
Where  x is the strain at the sensor location in Micro Strains, σX and σY are the stresses calculated at the slab top or bottom in psi, and the Poisson’s ratio µ = 0.15. The factor 4/5.5 is to convert the surface stress into the strain at the measurement point 1.5 inch from the surface. It seems that the 2D model (JSLAB) underestimates while the 3D model (EverFe) overestimates the strains, but both overestimate the curling displacements. Careful observation of Figure 3(b) indicates that the strain changes due to the load from 10,000 lbs to 30,000lbs predicted by the two models are relatively close to what were measured – if the upper or lower sections of the three curves are examined between 10,000 to 30,000 lbs in Figure 3(b), they will be found to match well.
Curling Dispalcements and Edge Strain Responses When the Slab Reached its Lowest Curling on December 5, 2003
On October 20, when the slab experienced the highest curling, the load tests were conducted. Immediately after the tests were completed, the slab was again covered with burlap and then watered routinely to assure that the burlap was completely wet. Figure 2(a) indicates that the slab quickly curled back, and after about fifteen days the slab experienced another stable period.
(a) VD1 and VD5
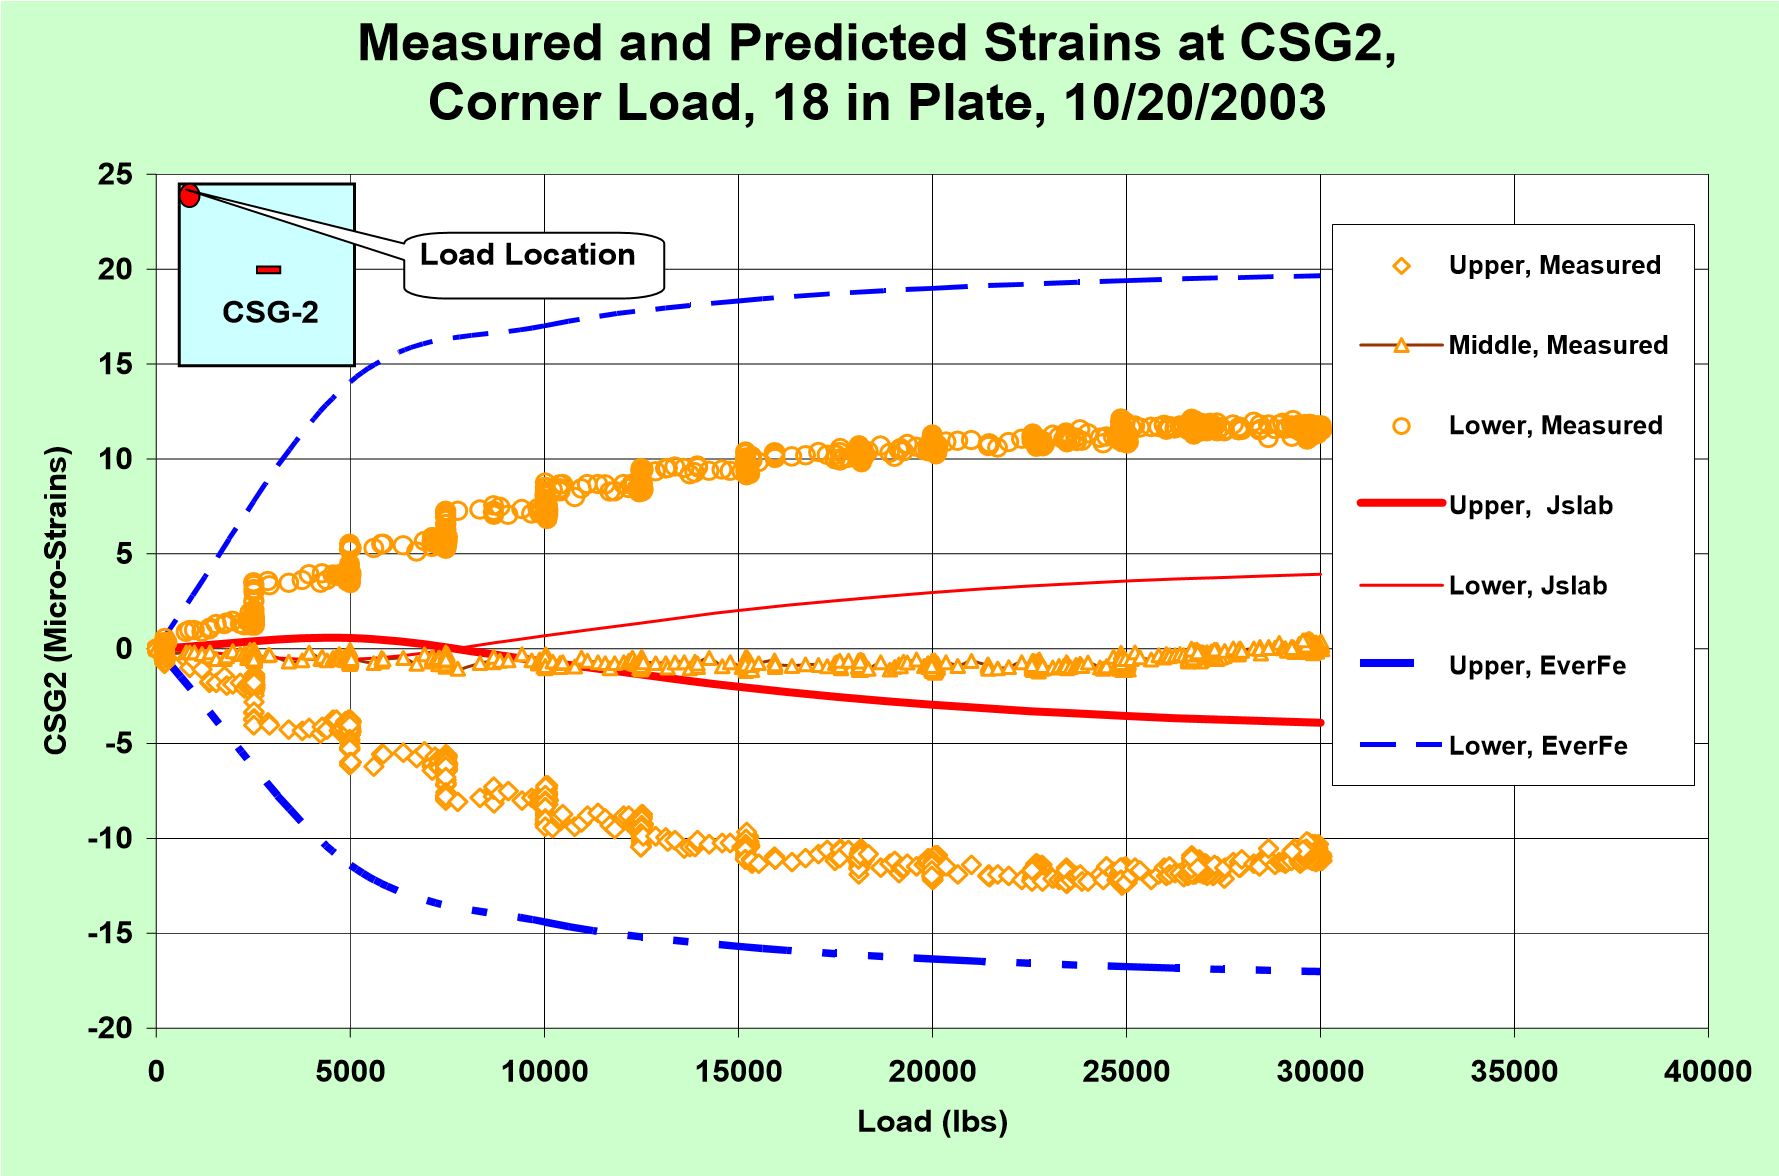
(b) Bending Strains at CSG2
Figure 3. Measured and Predicted Slab Rocking under a Corner Load, Initial Slab Shape: ETG = -6.0 ºF/ inch for Jslab, ETG=-5.5 ºF/ inch for EverFe (See Figure 2(b))
Unfortunately, VD2 did not work well a few days after the watering started so the sensor was finally disconnected. Records of VD1, VD4 and VD5 behaved similarly before the watering, but VD1 behaved differently after the watering and showing that VD1 curled back more than the other two. Before the second static test was conducted on December 5, all corner curling displacements were again measured by using the feeler gage. The VD1 and DV4 readings were 54 and 74 mils, and the VD5 and VD3 readings were 87 and 100 mils. This indicates that the watering made the slab curl down unevenly. Based on Figure 2 (b), the curled initial shape of the slab, on December 5, 2003, was between ETG ≈ -2 to -3 ºF/in. The displacements at VD4 under the load are presented in Figure 6(a). The phenomena observed in Figure 3(a) are observed again:
(1) Regardless if ETG=-3 ºF/in or =-2 ºF/in is used in analysis, the measured and predicted displacements by the two models under the load from 10,000 lbs. to 25,000 lbs. are much closer than those under the load from 0 to 10,000 lbs.;
(2) The results by using smaller ETGs in the analysis generally provide a better match with the test data;
(3) Even if the initial slab shape is assumed to be flat, the Jslab2002 and EverFe finite element models perform differently. First, corner displacements by the Jslab2002 are completely linear while the displacements by EverFe are slight softening nonlinear (the displacement due to the load increment from 15,000 to 25,000 lbs. is slightly higher than that due to the load increment from 0 to 10,000 lbs.). Both are different from the measured ones – slightly hardening nonlinear (the displacement due to the load increment from 15,000 to 25,000 lbs. is higher than that due to the load from 0 to 10,000 lbs.); second, the foundation in Jslab2002 shows slightly stiffer than the foundation in EverFe.
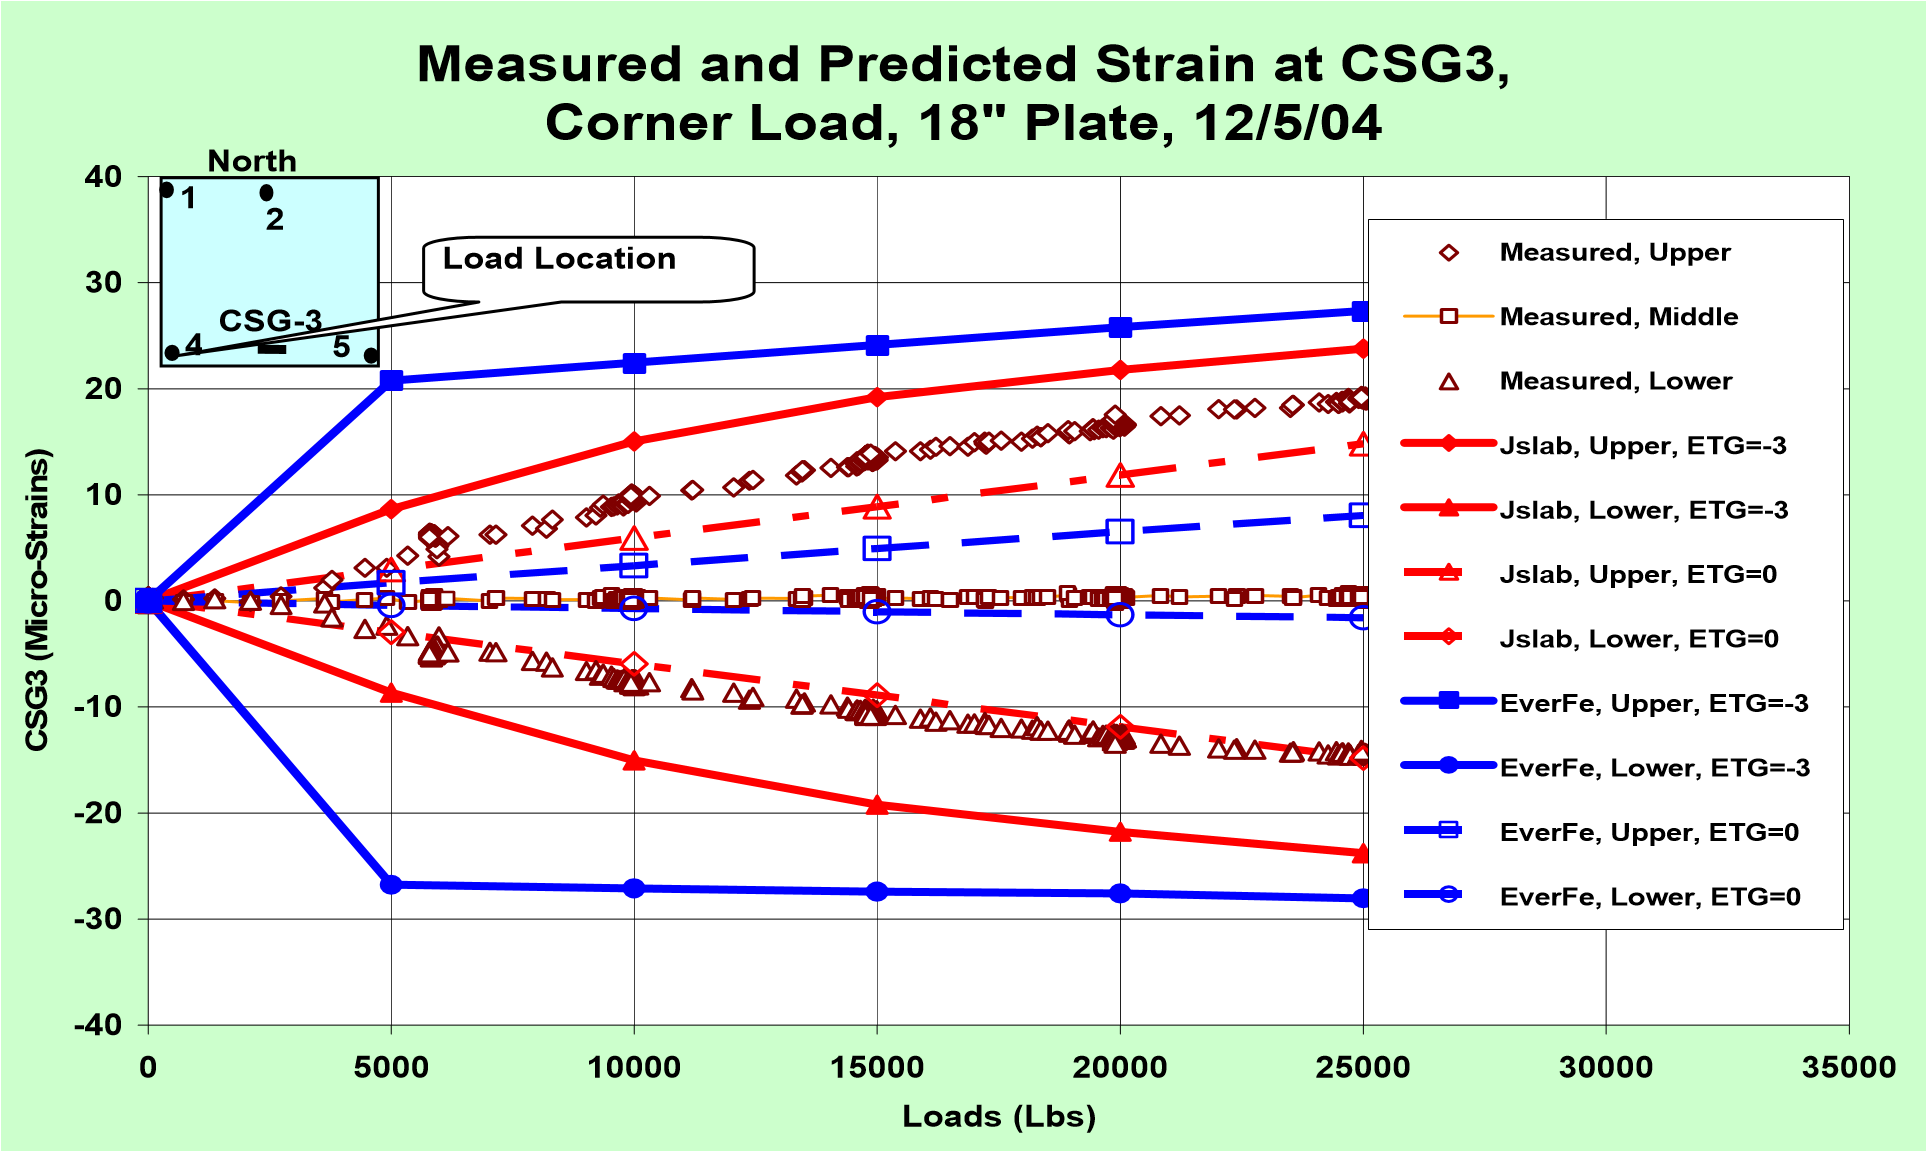
The comparisons of strains at CSG3 are given in Figure 4(b). Comparison of Figures 4(b) and 4(a) indicates that when ETG = -3 ºF/in is assumed, EverFe predicts that the slab contacted the base after a 5,000 lb. load was applied while predicts that the slab contacted the base after a 20,000 lb load was applied. Therefore, the strain slope calculated by EverFe remains constant after the load > 5,000 lbs. while the strain slope calculated by the Jslab2002 varies until the load > 20,000 lbs. Another difference between the measured and predicted response is caused by friction effects between the slab and base. The measured magnitude of upper strains, 1.5 inches from the slab surface, was higher than that of the lower strains, 1.5 inches from the slab bottom. Since Jslab2002 is developed based on a dense liquid foundation no friction effect can be considered. Therefore, the predicted upper and lower strain magnitudes are always the same. The EverFe program has the capability of considering the friction effects. However, the results presented in this paper were obtained by assuming a frictionless interface. It is not clear why significant differences were calculated by EverFe, especially for the case when ETG = 0.
Information Worthy of Consideration in Pavement Design
The following are some observed test results which may provide useful information for the development of, or modification to, the pavement design procedures.
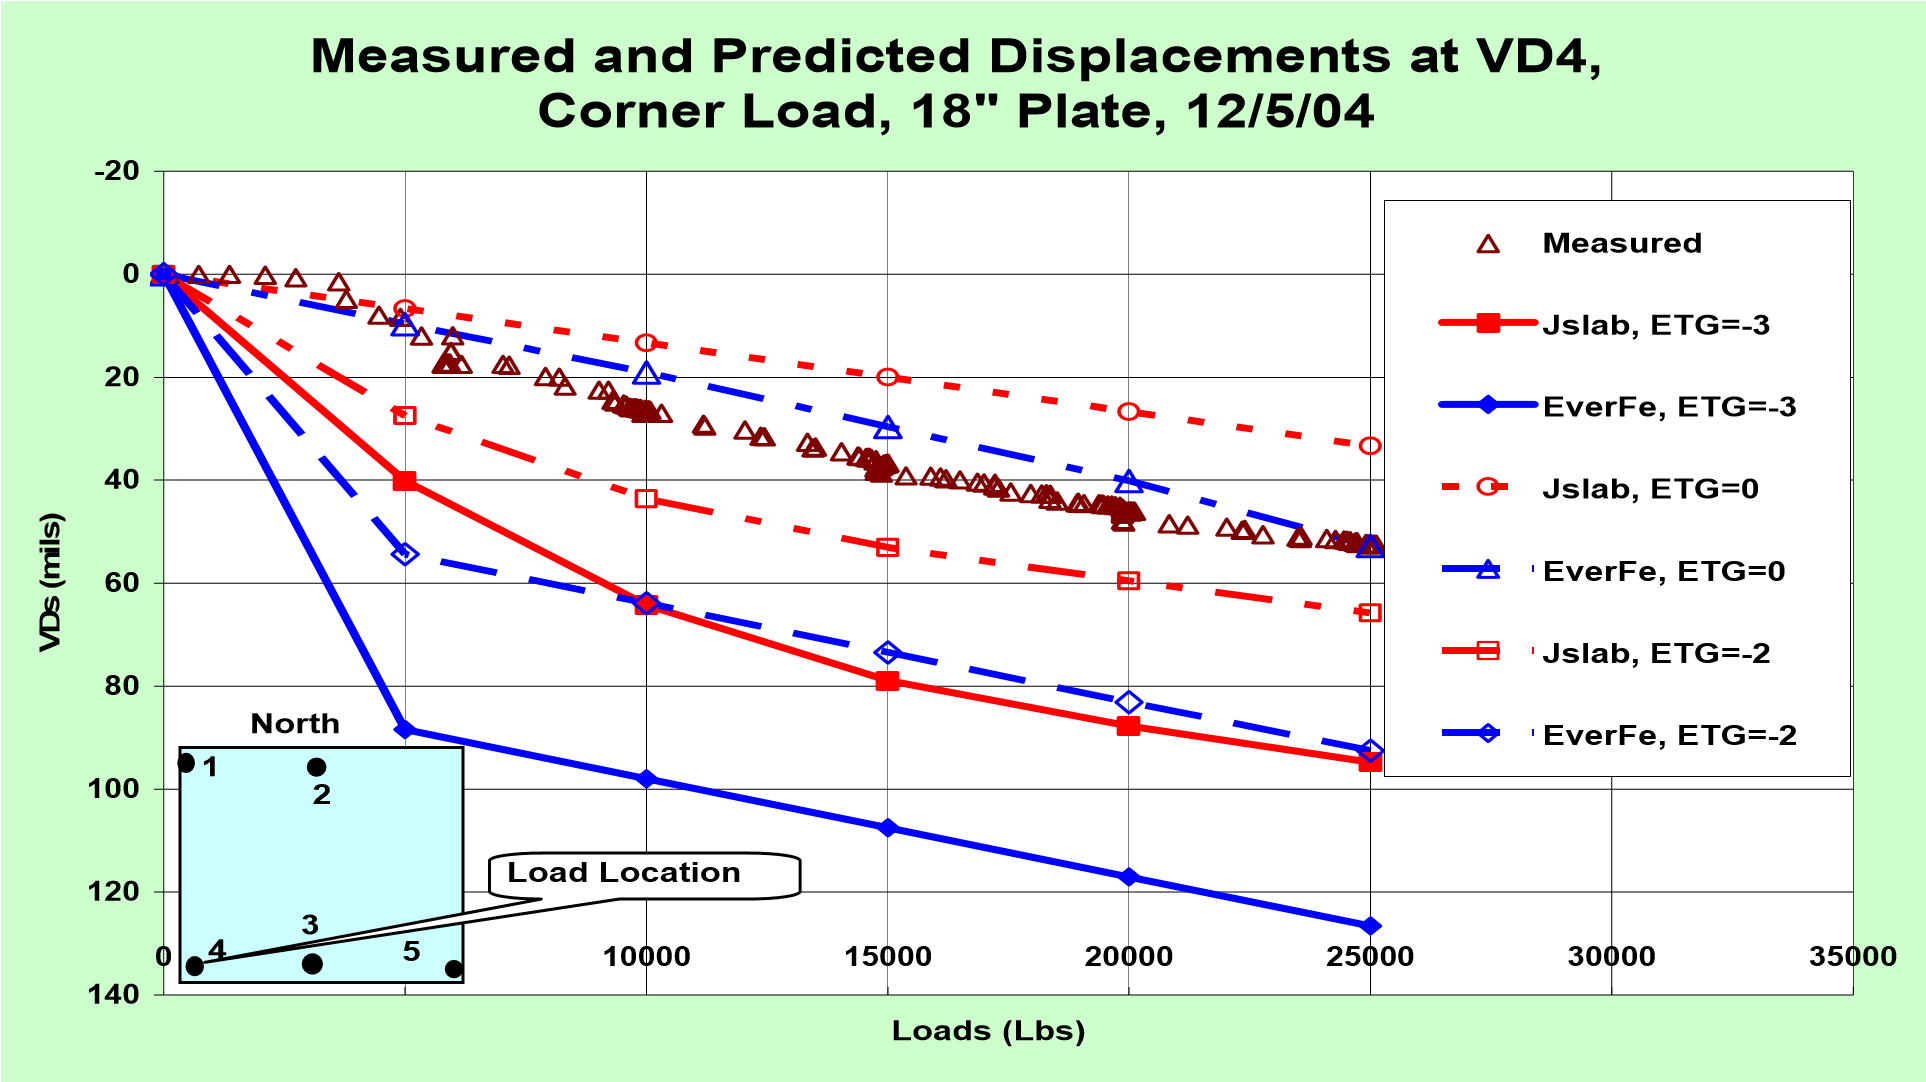
(a) VDs
(b) Strains at CSG2, West Edge Load
Figure 6 Measured and Predicted Slab Rocking and Edge Strain under a Corner Load
Figure 5 presents the measured and predicted strains in CSG3 under an edge load above on top of the strain gage. It can be seen in Figure 5 that the load induced maximum strain is overestimated by the results calculated by both the Jslab2002 and Nike3D programs if the loaded edge is modeled by a “Cliff” type edge (Figure 5). The magnitudes of Jslab2002 results are even higher. However, when the second and lower layers are extended 30 inch, the loaded edge looks like a “Step” and is defined as “Step Model”, see Figure 5. The results predicted by the 3D finite element program Nike3D match the measured one much better. The comparisons in Figure 5 indicate that the “Step Model” seems more appropriate than the “Cliff Model” for predicting the maximum edge stress of a PCC pavement resting on econocrete subbase layer. Therefore, the “Step Model” has been proposed in FEDFAA – the next generation FAA Airport Pavement Design Procedure which is developed based on the 3D finite element model [5].
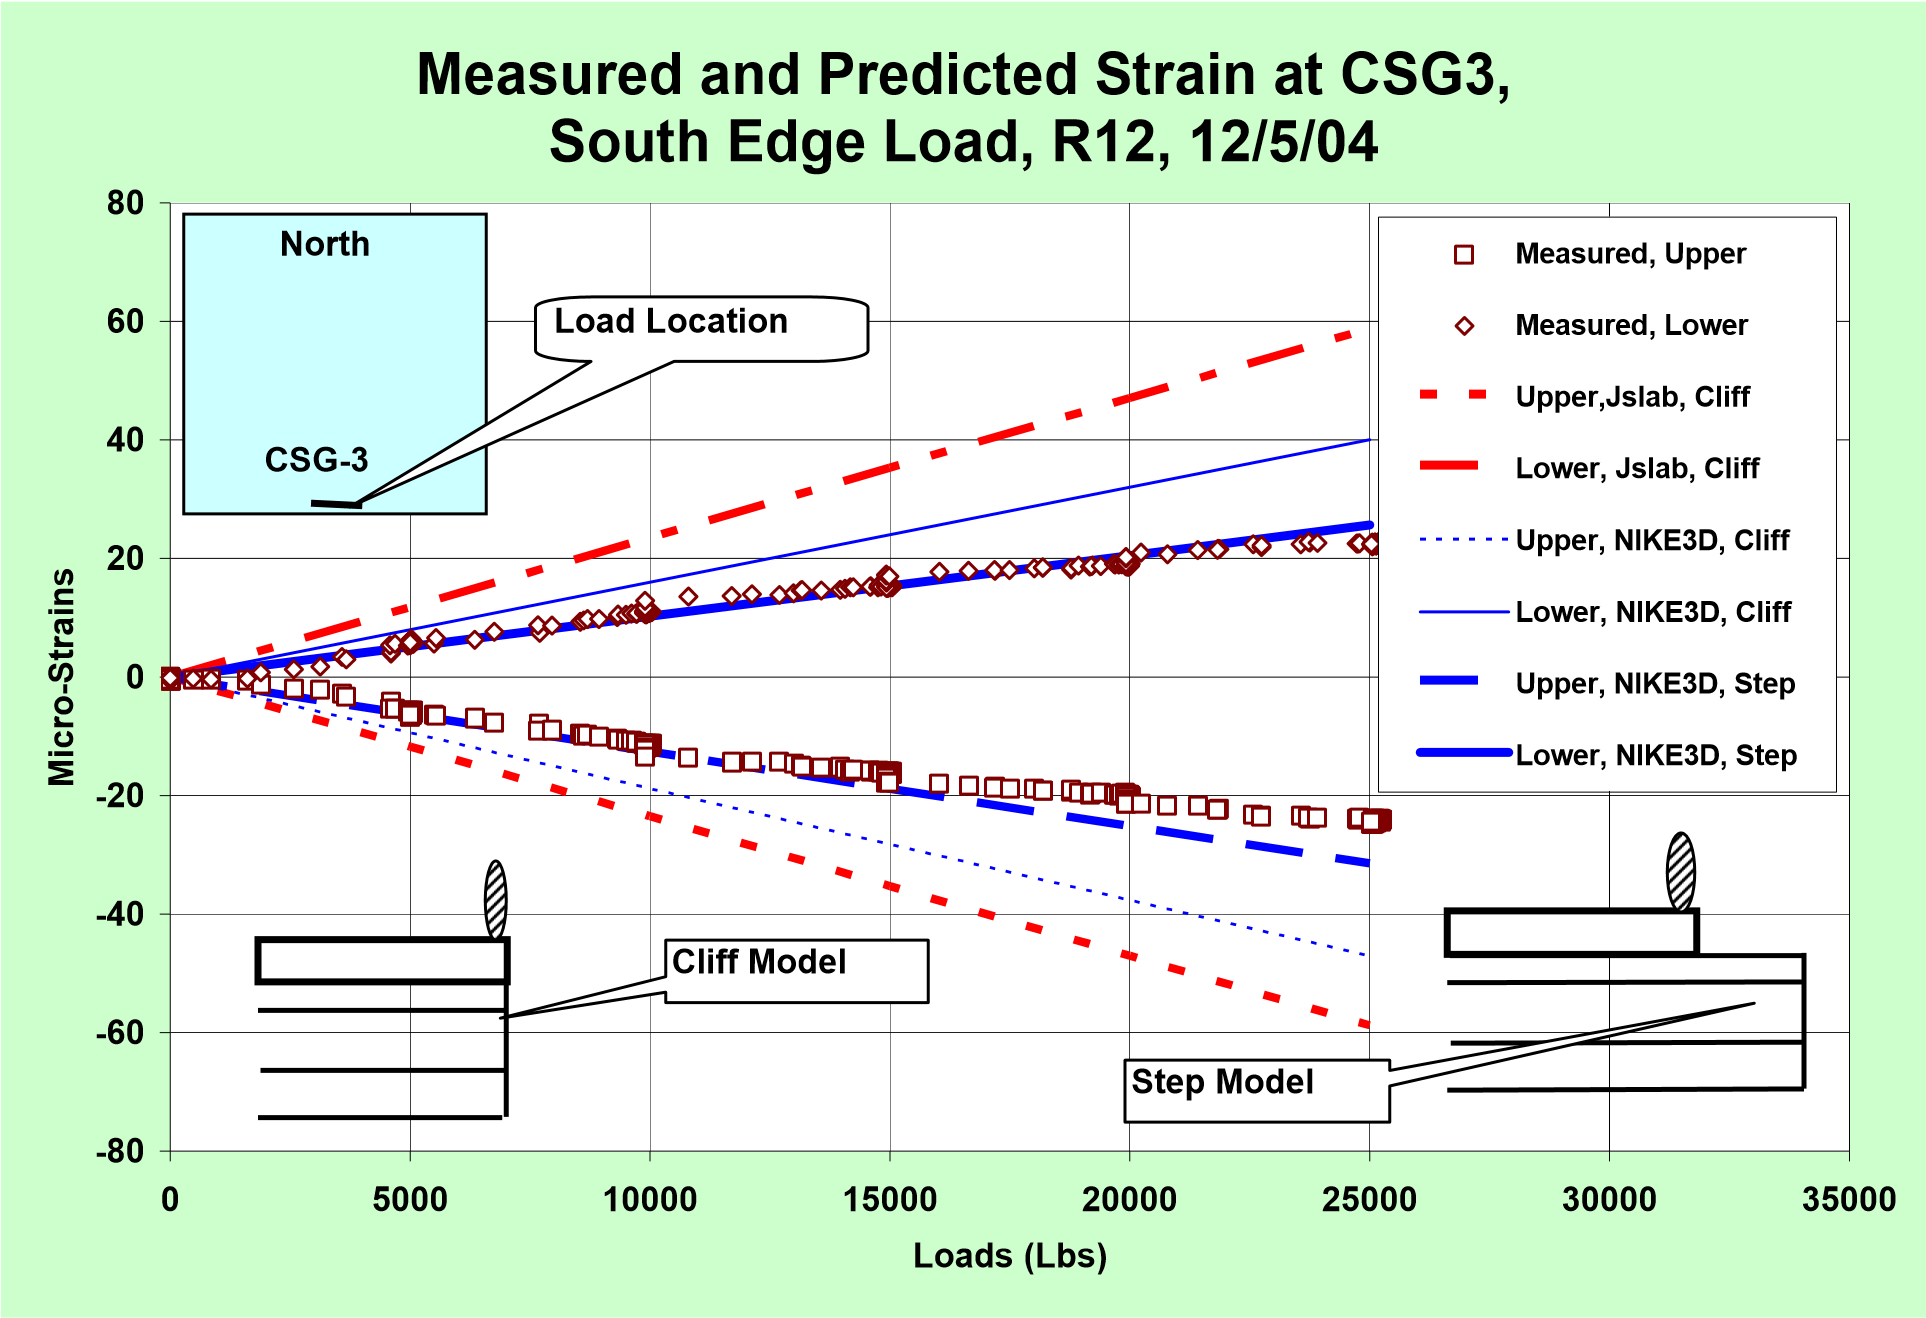
Figure 5. Measured and Predicted Edge Strain under an Edge Load
In the static tests, a load on different plate sizes, from 18 inches down to 6 inches, was applied at the slab center. The strain-load curves for CSG2 are presented in Figure 6(a). The CSG2 was six inches from the slab center. The following information has been noted.
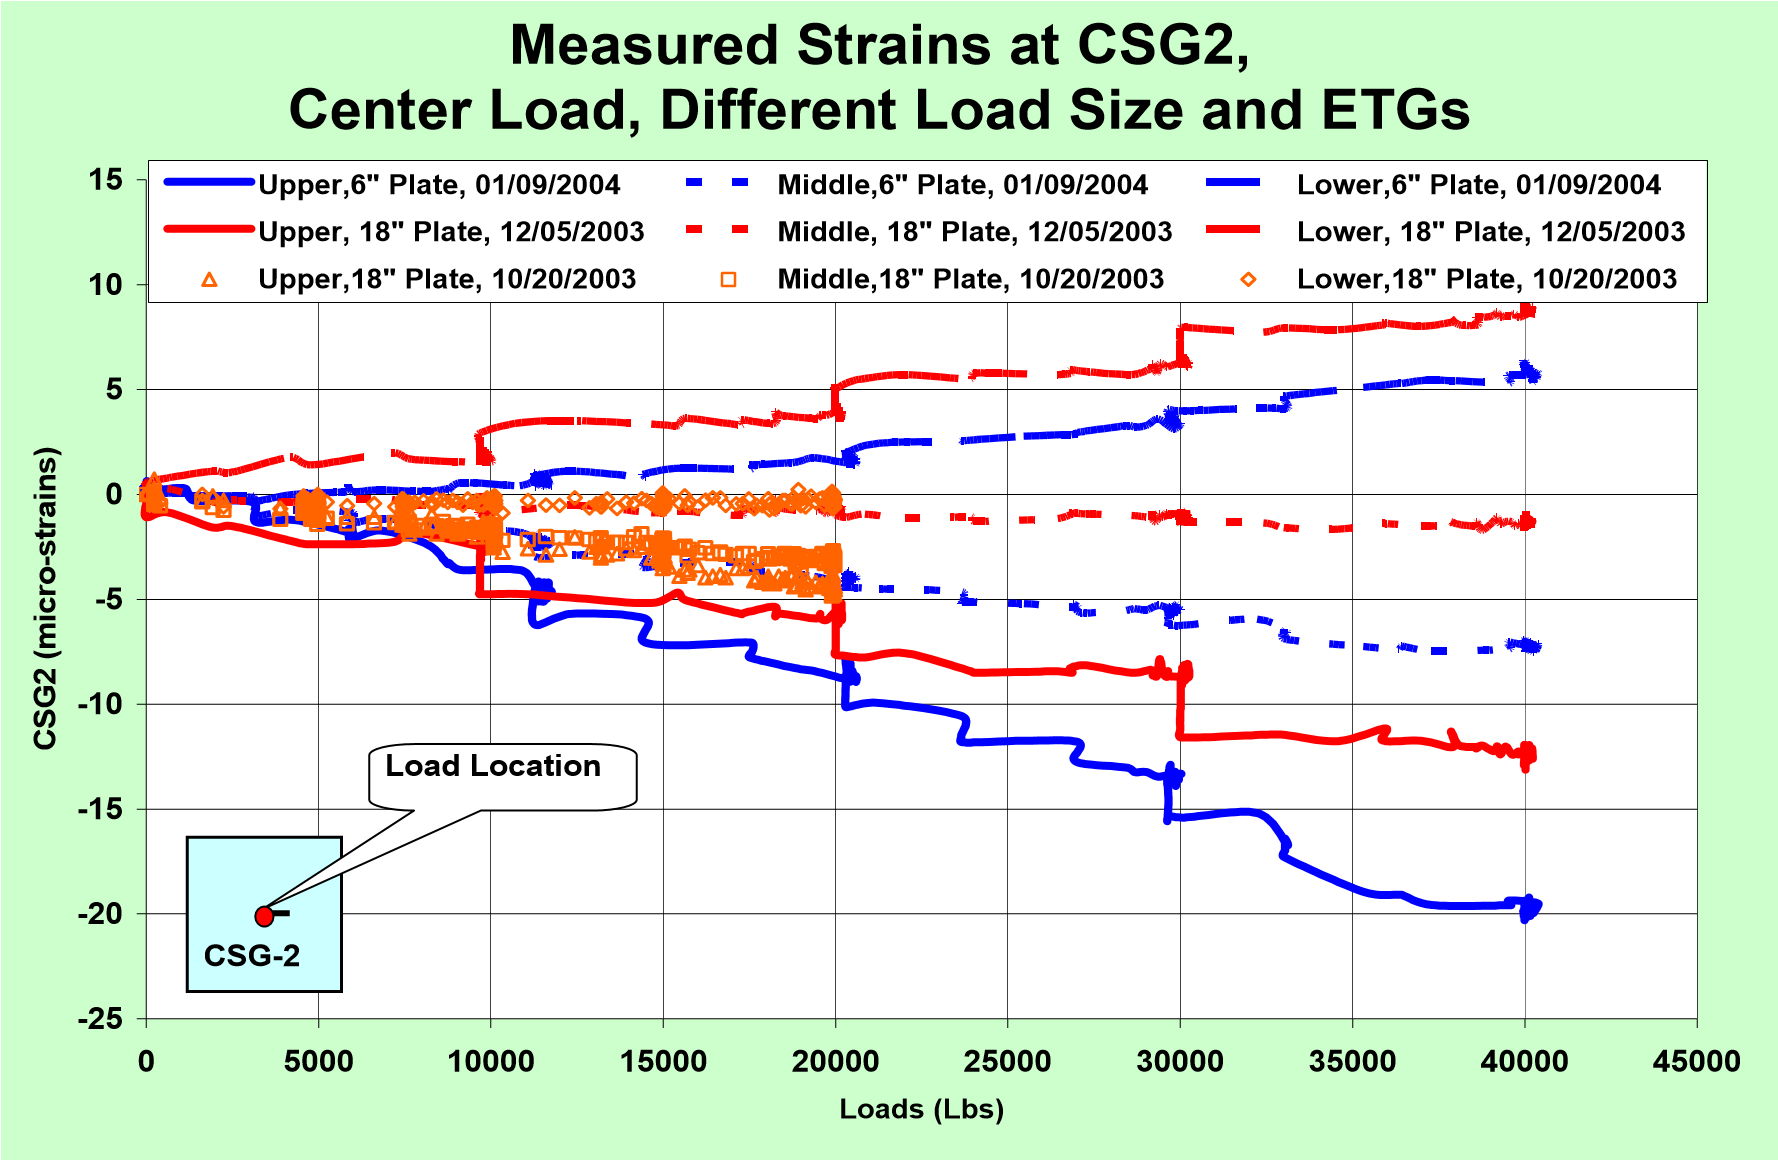
(a) Measured Strains
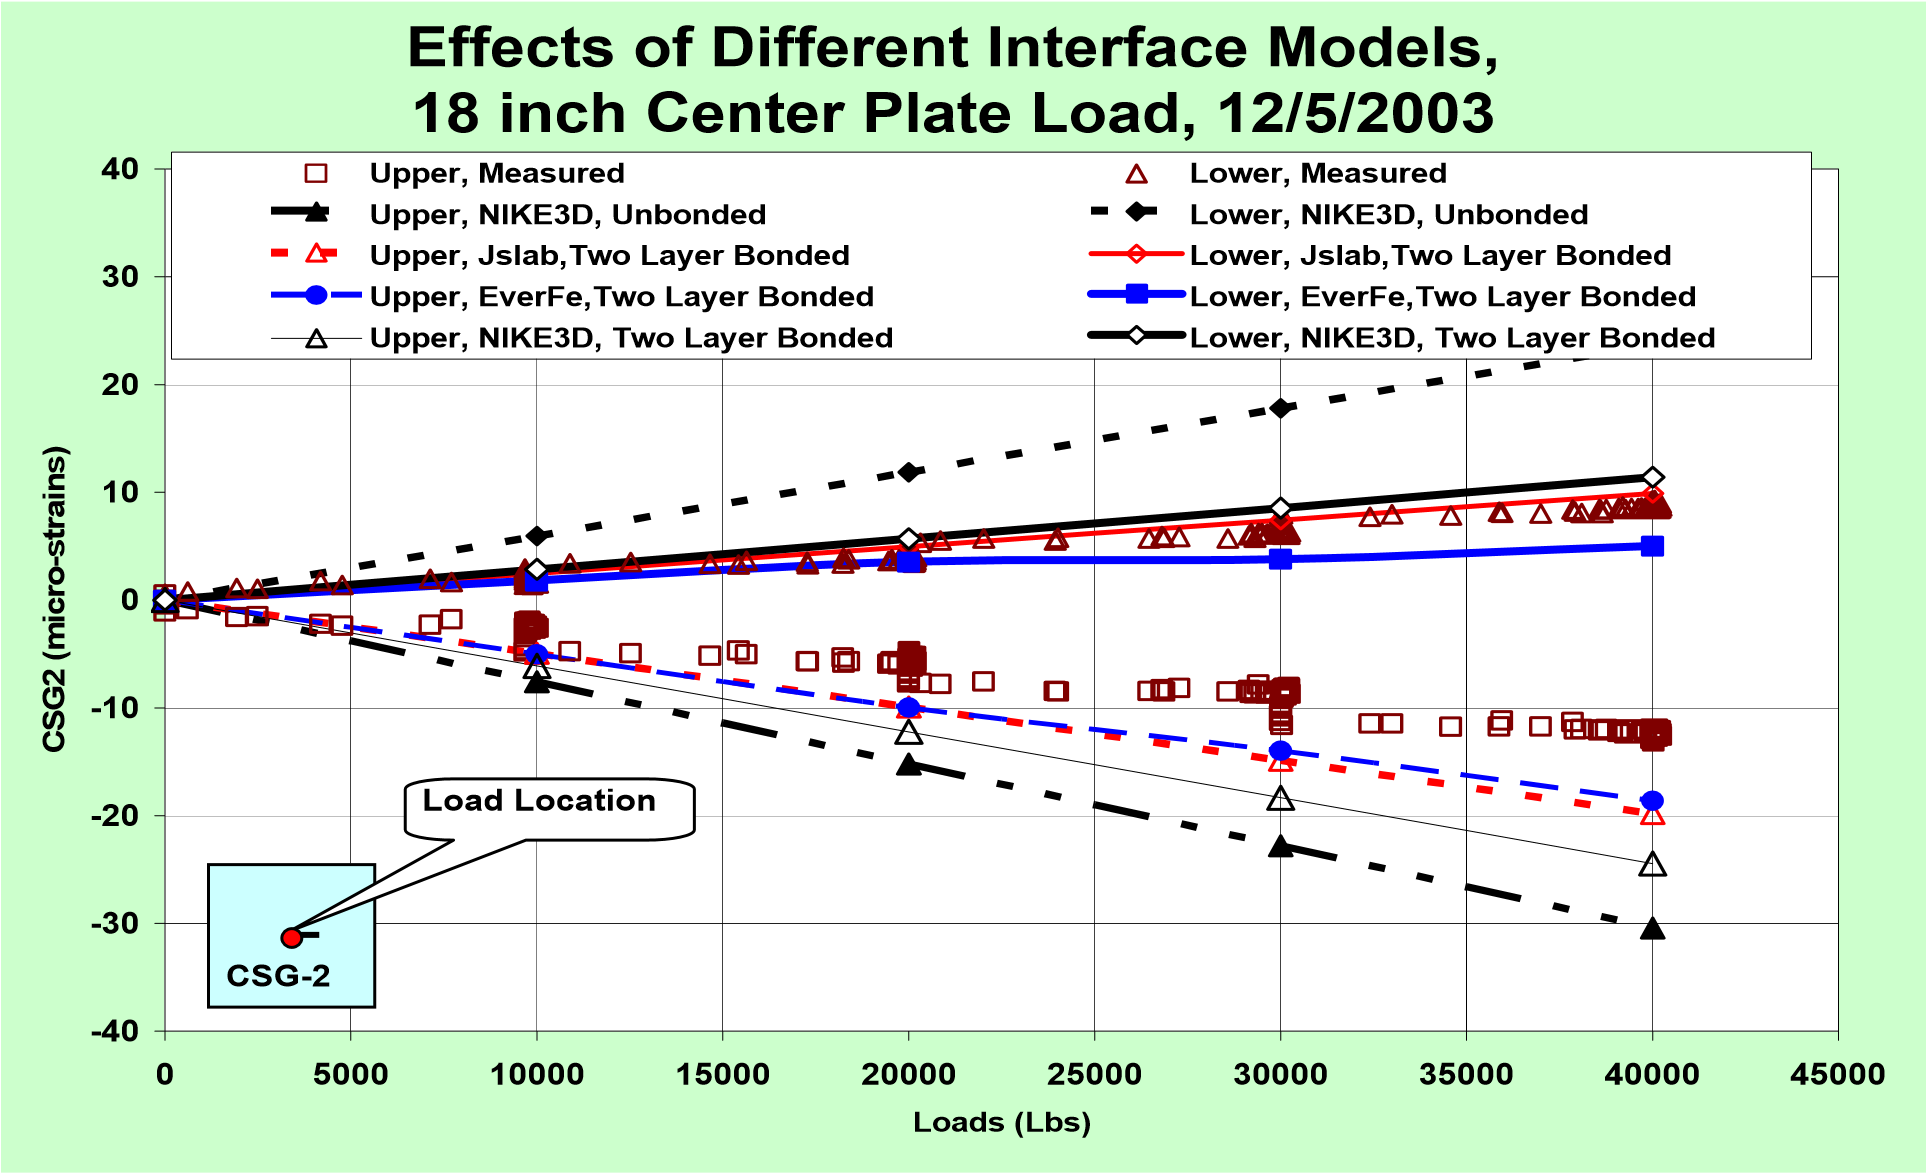
(b) Effects of Interface Models in Programs
Figure 6. Uncertain Interface Behavior and Modeling
(1) When the test was first conducted, October 20, 2003, using an18 inch plate, the slab had reached its highest curling. The friction force in the interface shifted the neutral axis of the cross section from the middle of the slab thickness to approximately 1.5 inches from the slab bottom surface. The strains in CSG2A, 1.5 inches from the slab bottom, were almost holding to zero when the load increased from 0 to 20,000 lbs.
(2) On December 5, 2003, the static test was conducted after the slab curling reduced to the lowest curling state (the four corner curling displacements dropped from an average 195 down to 79 mils after watering the surface). The load was applied at the slab center again on an 18 inch plate. Figure 6(a) shows that the upper micro stain was -12.5 and the lower micro strain was about 9. The sensor at the middle of the slab thickness received a micro strain = 1.5 which indicates the interface friction had less effect than it had on October 20, 2003.
(3) On January 9, 2004, the test was repeated by using a six inch plate. The results are also shown in Figure 8(a). The maximum difference in micro strains between the measured upper and lower strains under a six inch plate (20 + 6 = 26) was slightly higher than that under an 18 inch plate (12.5 + 9 = 21.5). This indicated the bending under a 6 inch plate was higher than that under an 18 inch plate. However, the measured middle strain under a six inch plate was -7 which indicated stronger friction effects than the test on December 5, 2003.
(4) Figure 6(b) presents the strain histories predicted by Nike3D, EverFe and Jslab2002 with different interface models. When an unbonded interface (frictionless) is used all three models significantly overestimate the strains (only Nike3D results are shown in Figure 6(b)). However, when the interface between the top and second layers is assumed fully bonded, the lower strains predicted by all three models are closer to the measured ones. The elastic modulus of the broken slab (the second layer) is set at 3,000,000 psi in the calculation, however, it is difficult to precisely estimate the E value for a broken slab. The adjustment of the E value can bring the predicted results even closer to the measured ones.
(5) All measured strains indicate that more or less bonded behavior is experienced when a load is applied at the slab center. However, the friction effects were more significant in the center loading cases than the edge loading cases. It is also true that the bonding reduces the maximum stress at the bottom of the slab. The test results verify that the fully unbonded interface condition overestimates the maximum interior stress at the slab bottom. Therefore, in conjunction with the sensitivity analysis and the information provided in other investigations [2], [3] and [10], though the maximum interior stress has been considered in determining the critical stress [4], it will not be considered in [5] for pavement design.
CONCLUSIONS
Two types of interface characteristics significantly influence the critical stresses of a PCC slab under a static load. The first type is the degree of interface unevenness which has significant effects on the predicted top-down critical stresses. The unevenness of the interface leads to the slab contacting the concrete (or econoconcrete) base earlier than predicted by both 2D and 3D finite element models. The models also considerably overestimate the maximum load induced top-down stress for a slab curled up at the corners. The comparison between the measured strains in the test slab and the strains predicted by 2D and 3D finite element programs indicates that the major discrepancy occurs when a slab experiences a great degree of curling. When the slab keeps contact (or almost keeps contact) with the second layer, the measured strains and those predicted by both models are close. The second type is the bonding condition of the interface which mainly influences the bottom-up critical stresses. The bonding is always observed though it varies when a load is applied near the slab center. The bonding always reduces the critical bottom-up stress from the fully debonded condition. Reliable test data and reliable computer programs are both necessary to obtain above conclusions. The analysis of the test data supports two suggestions for modifying the FAA airport pavement design procedures: (1). The “Cliff model” should be replaced by the “Step model”, in the finite element analysis, in order to calculate the critical bottom-up edge stress. (2). Considering the bonding characteristics, the critical interior stress at the bottom of a slab is always lower than the predicted critical edge stress, so that it does not need to be calculated in the procedure for pavement thickness design.
REFERENCES
1. Brill, R. D, Field Verification of a 3D Finite Element Rigid Airport Pavement Model, DOT/FAA/AR-00/33, July 2000.
2. Dong, May and Edward H. Guo, Pavement Joint and Interface Behavior at the FAA Test Site at Denver Airport, Federal Aviation Administration Technology Transfer Conference, 1999. 3. Dong, May and Gordon Hayhoe, Analysis of Falling Weight Deflectometer Tests at Denver International Airport, Federal Aviation Administration Technology Transfer Conference, Atlantic City, 2002.
4. FAA, Airport Pavement Design for the Boeing 777 Airplane, Advisory Circular AC 150/5320-6D, 1995.
5. FAA, Finite Element Design, Federal Aviation Administration, (FEDFAA), 2004
6. FAA, 3D Finite Element Analysis of Rigid Airport Pavement, (FEAFAA), available HERE, 2004
7. Guo, Edward H & May Dong, JSLAB-2002 Technical Report, under contract DTFH61-01-P- 00255 with the Federal Highway Administration, 2002
8. Guo, Edward H, Back-estimation of Slab Curling and Joint Stiffness, Proceedings of 7th International Conference on Concrete Pavements, September 9-13, 2001, Orlando, Florida. p39-44.
9. Maker, B.M., Nike3D – An Nonlinear, Implicit, Three-Dimensional Finite Element Code for Solid and Structural Mechanics – User’s Manual Report, UCRL-MA-105268, Rev. 1, Livermore, California, Lawrence Livermore National Laboratory, 1995.
10. Rufina, Dulce, Jeffery Roesler and Ernest Barenberg, Mechanistic Analysis of Pavement Responses From Denver International Airport”, Technical Report of Research supported by the FAA under Grant DOT 95-C-001, 2004
11. Suprenant, Bruce A, and Discussion by R.E. Tobin, Why Slabs Curl? Part I and II, Concrete International March and April, 2002, discussion on October, 2002.
12. University of Washington and University of Maine & DOT of Washington State, EverFe V2 User’s Manual , 2003.