Material Test Reporting
Curling on PCC Test Strip
From March 6 to 7, 2002, using the available instrumentation, a static test was conducted on the test strip to determine the slab curling, based on load-deflection relationships, for the different slab sizes. A static load was applied at different locations in the 4.5 meter (15 feet) and 6 meter (20 feet) slabs. A two-wheel gear with 112 cm (44 inches) dual spacing was used with a maximum tire load of 23 tonnes (50,000 lbs). The load was increased from 0 to 23 tonnes (50,000 lbs), maintained for 10 seconds, and then released in a repetitive sequence (3 cycles).
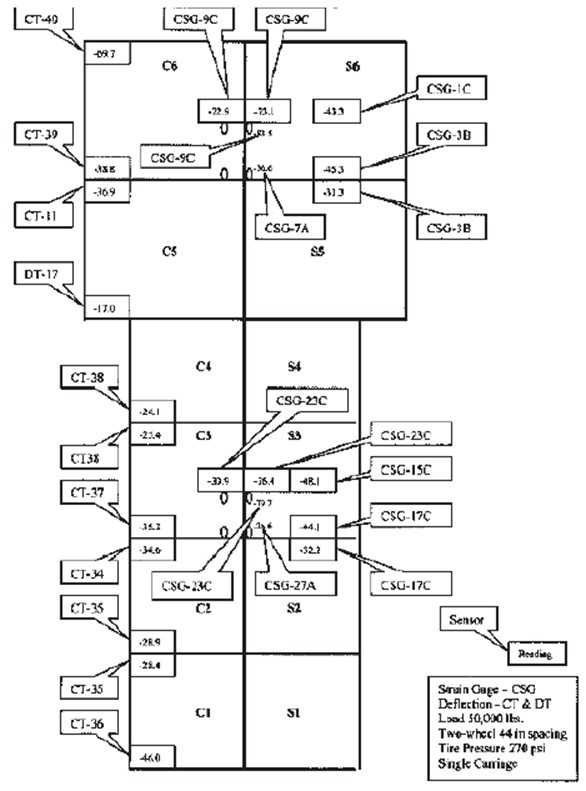
Figure 1. PCC Test Strip Instrumentation Response.
On March 18, the static tests conducted on March 6, 7 were repeated because the deflection transducers (DT) readings showed two-digit deflections in most of the tested slabs (from 24.1 to 46 mils) except at the edge of slabs C5 and C6, where the deflection readings were in single digits (from 6.2 to 7.9 mils). Load transfer was evident between slabs C5, C6 and the original PCC pavement. The longitudinal joint between the original and new concrete mix north of slabs C5 and C6 was saw-cut up to 25.4 mm (10 inches) depth to avoid any load transfer which could have affected the 6 x 6 meter (20 x 20 feet) slabs curling behavior under study. The deflection transducer readings after the “saw cut” increased and are shown in Figure 1. The 4.5 x 4.5 meter (15x15 feet) slabs showed smaller deflections than the 6 x 6 meter (20 x 20 feet) slabs.
Additional slow rolling tests were conducted on March 15 to verify the location of critical responses under a four-wheel gear with 112 cm (44 inches) dual spacing and 148 cm (58 inches) tandem spacing. The load per wheel was 23 tonnes (50,000 lbs). The tests were conducted at a speed of 2.5 miles per hour (0.5 feet per second) and positions to pass exactly over sensors CSG 5 and 6 located in slab S5 and CSG 18, 19, and 20 located in slabs S2, S3 and S4.
Flexural Strength on PCC Test Strip
To determine the flexural strength at the slab top and bottom edges, a maximum static load of 34 tonnes (75,000 lbs) per wheel was applied on the north edges of the “C” slabs. The tests were conducted on April 9. Additional external sensors installed on slabs C5 and C6, required the vehicle wheel outer edge to be located 15 cm (6 inches) inside the slab edge. The dual-wheel gear load with 137 cm (54 inches) dual spacing was increased from 0 to 34 tonnes (75,000 lbs) and was maintained for 10 seconds at every test location. The test was repeated on April 11. Table 1 shows the deflection readings comparison for the tests on both dates. After the initial testing (April 9) a crack developed from the bottom of slab C2. On April 11, the crack expanded and changed direction without reaching the slab top (about three fourths of slab thickness). A second crack initiation was observed at the bottom of slab C2 on the same date.
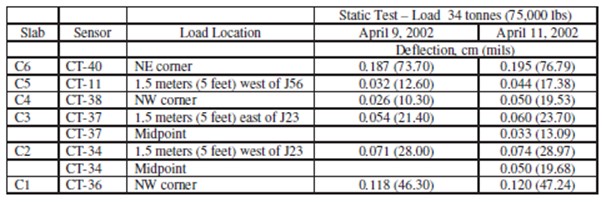
Table 1. Deflection Comparison for Static Tests
Trafficking PCC Test Strip
Traffic tests started March 18 using a four-wheel gear with 112 cm (44 inches) dual spacing and 148 cm (58 inches) tandem spacing. The load was 25 tonnes (55,000 lbs) per wheel moving at a speed of 4.023 km/h (3.667 ft/sec). The trafficking started following a wander pattern consisting of 66 positions designed to simulate a normal traffic distribution. After 46 passes, the slab surfaces were checked for cracks. Two corner cracks were visible, one at the northeast corner of slab S6 and one at the southeast corner of slab C6. The traffic was stopped. On March 19, two cores were taken from each crack location. The cracks extended from the slab top through three fourths of the slab thickness in both cases. The trafficking continued following the wander pattern described above. Specifics of the wander pattern are available at NAPTF’s web site. The test strip trafficking was completed on April 11, 2002 after 8,087 repetitions. The 4.5 meter (15 feet) slabs exhibited fewer corner cracks for equal passes than the 6 meter (20 feet) slabs. Corner cracks developed after 46 passes under the 25 tonnes (55,000 lb) load in slabs C6 and S6. Figure 2 presents the trafficking results for the test strip (passes for the first crack). Although corner cracks were developed first in most of the test strip, the 4.5 meter (15 feet) slabs using the optimized mix (S2, S3 and S4 slabs) developed edge cracks before corner cracks after 4,000 to 5,000 passes.
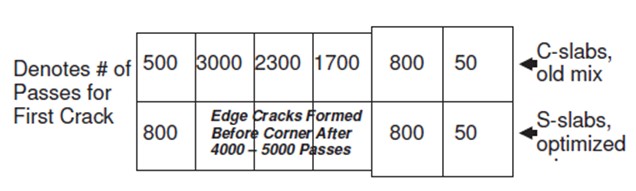
Figure 2. Trafficking Results.