Trafficking
Original plans for trafficking considered 6-wheel loading (north side) and 4-wheel loading (south side) with 55,000 lbs. (24,950 kg) per wheel at speed 2.5 mph (4 km/h) and standard wander pattern of 66 passes per cycle. The pass-to-coverage ratio (P/C) was 4.71 for both 4-wheel and 6– wheel gear configuration. However, due to the variable flexural strength of the built test items: MRC - 744 psi (5.13 MPa), MRG - 833 psi (5.74 MPa) and MRS - 691 psi (4.77 MPa) and the short life predicted by FAA design procedures, it was decided to first test only MRC south under 55,000 lbs. (24,950 kg) and 4-wheel load.
Trafficking Test on MRC Test Item
On April 27, traffic testing was conducted on MRC to observe the effect of the heavy wheel load on the new rigid pavement. Initially only the SWT of MRC was trafficked using the standard wander pattern with 66 passes. The corresponding gear positions are shown in Figure 1.
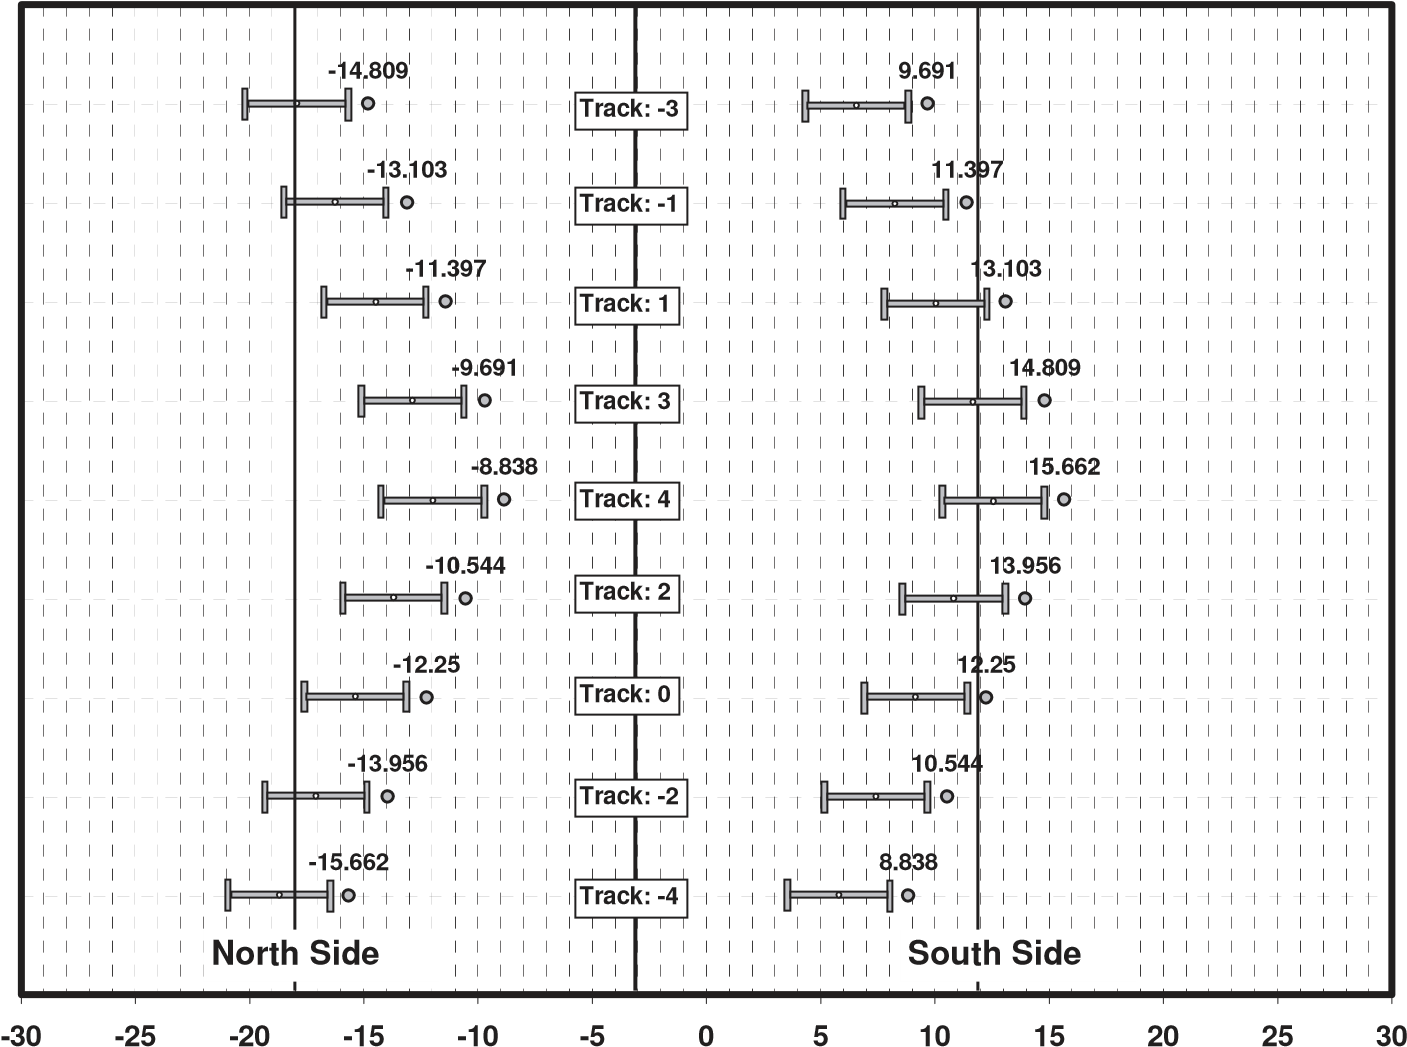
Figure 1. Standard Wander Pattern Gear Positions
Monitoring
1. Repetitions to failure. Traffic test monitoring will be based on three observations:
a. Visual survey. The pavement surface will be periodically inspected for evidence of cracks, spalls and other structural distresses. Cracks will be mapped and crack maps updated regularly. Distress data will be used to compute an equivalent SCI, which then can be plotted versus coverages.
b. HWD tests. These can be used to track deterioration in support conditions and/or loss of joint LTE.
c. Embedded sensors. Loss of sensors or unusual readings provide evidence of structural failure.
2. Failure conditions. Technically, structural failure of test items is defined in terms of the crack density. Testing will proceed until a “shattered” slab condition (slabs broken into 6 or more pieces) is observed.
3. Curling. Slabs will also be monitored for evidence of upward curling:
a. Vertical displacement transducer (VDT) readings at slab corners and interiors give evidence of slab-base separation.
b. Visual observation of slab displacement or rocking under wheel load.
c. HWD testing.
At about 400 passes, bottom-up cracks, perpendicular to the longitudinal joint, were detected by the CSG’s. But before these cracks propagated to the slab surface, top-down cracks were observed in four out of five outer-lane slabs in the south side of MRC. Since the effect of outer-lane top-down cracks on the initiation/development of the inner-lane bottom-up cracks was unclear, the wander pattern for the NWT of MRC was modified to eliminate direct loading of the outer lane slabs, maintaining the 4-wheel gear loading.
The modified wander pattern did not consider trafficking on the outer slabs of the NWT (Positions -1 through -4 were removed from the wander pattern) and the number of passes was increased to match the number of repetitions at critical locations (76 passes). The abbreviated wander pattern was used to traffic the NWT (P/C = 3.80) while the original wander pattern, increased by 10 passes to match the number of passes in the modified wander, was used to continue trafficking the SWT of MRC (P/C = 4.74). Figure 2 presents the final distress map and Table 1 the summary of events for the MRC test item.
Table 1. Summary of Traffic Events for MRC Test Item
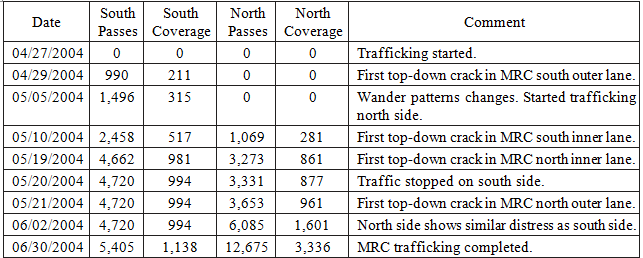
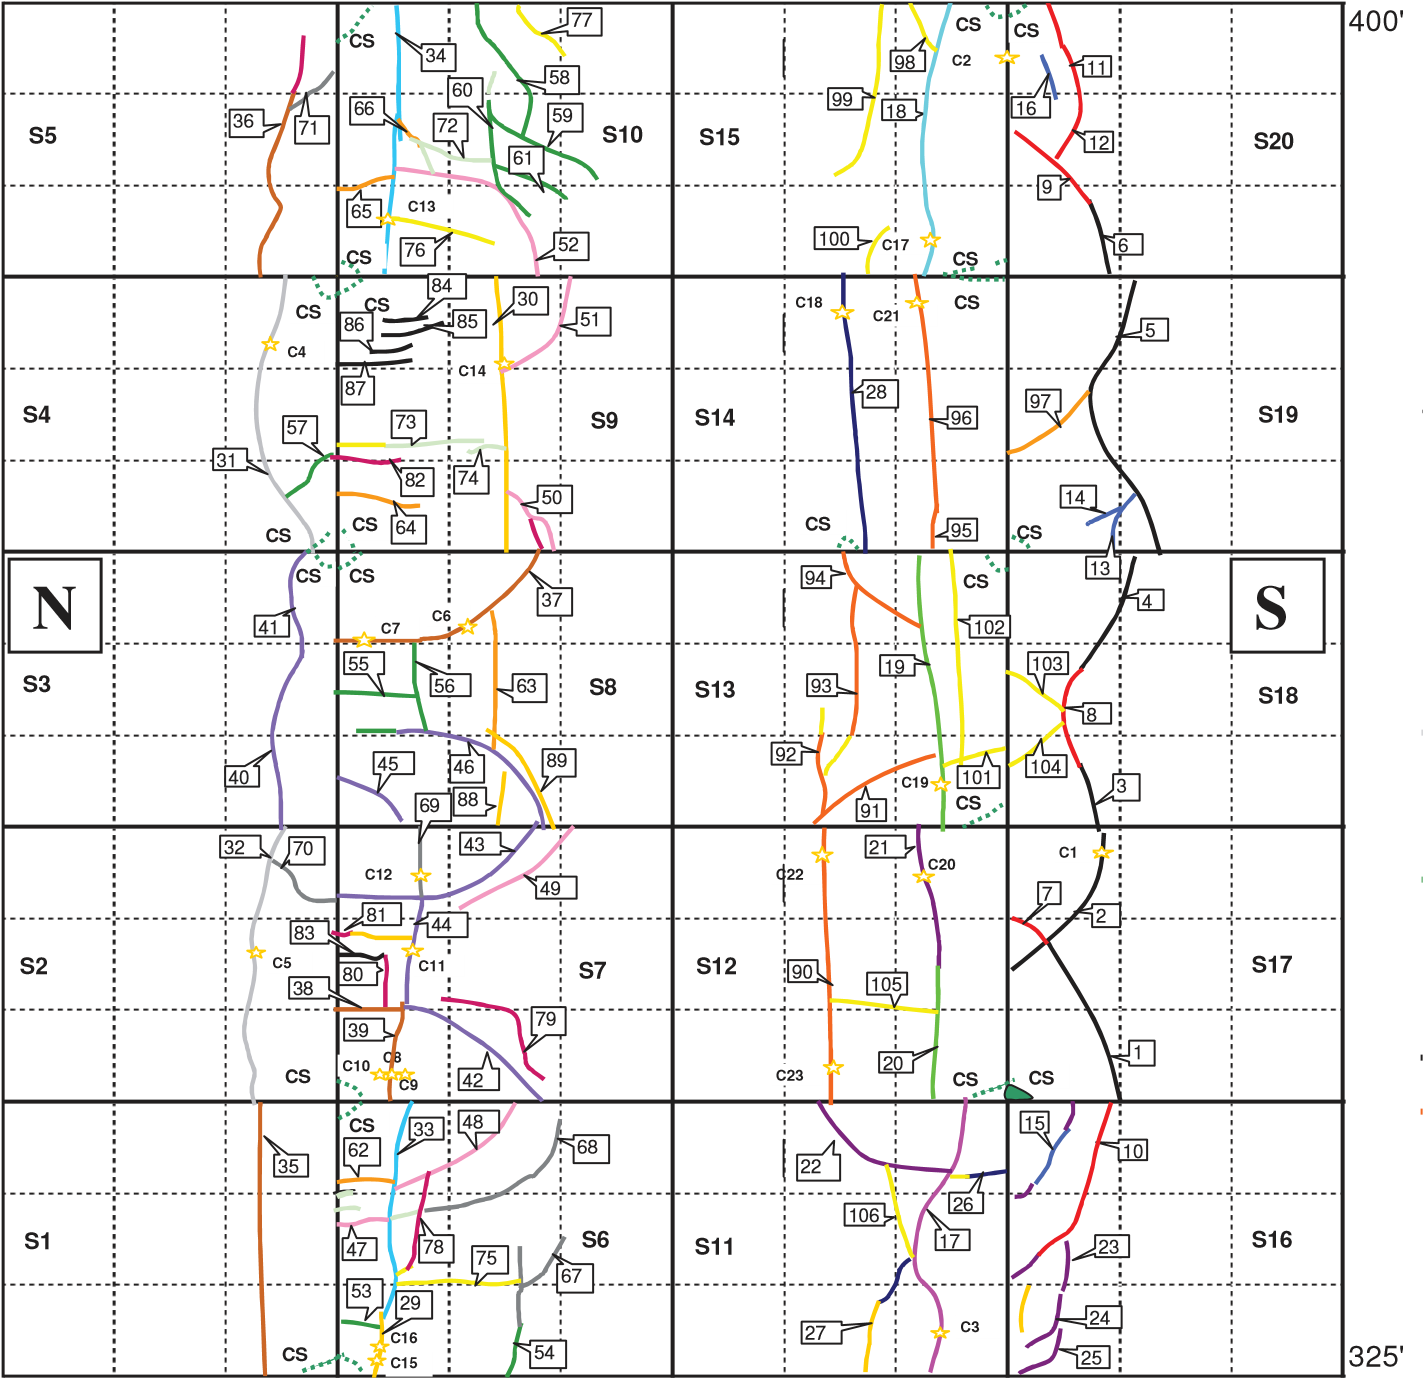
Figure 2. MRC Distress Map After 12,675 Passes on North Side (4-wheels) and
5,405 on South Side (4-wheels)
Trafficking MRG and MRS Test Items
MRG and MRS were trafficked using the following parameters: (1) Six-wheel loading in the north lane and four-wheel loading in the south lane, with a wheel load of 55,000 lbs. (24,950 kg), to compare the effect of the load configuration on pavement life; (2) Standard wander pattern of 66 passes per wander cycle (Figure 1). The carriages were positioned with the zero wander position having the outer sets of wheels on the inner slab lanes and adjacent to the longitudinal joints between the inner and outer slab lanes. The north and south carriages were programmed to move together, with the same distance held between the carriages, at all times; (3) since frequent watering was successful in maintaining the slabs nearly flat in MRC, it was continued for the duration of the trafficking on MRG and MRS.
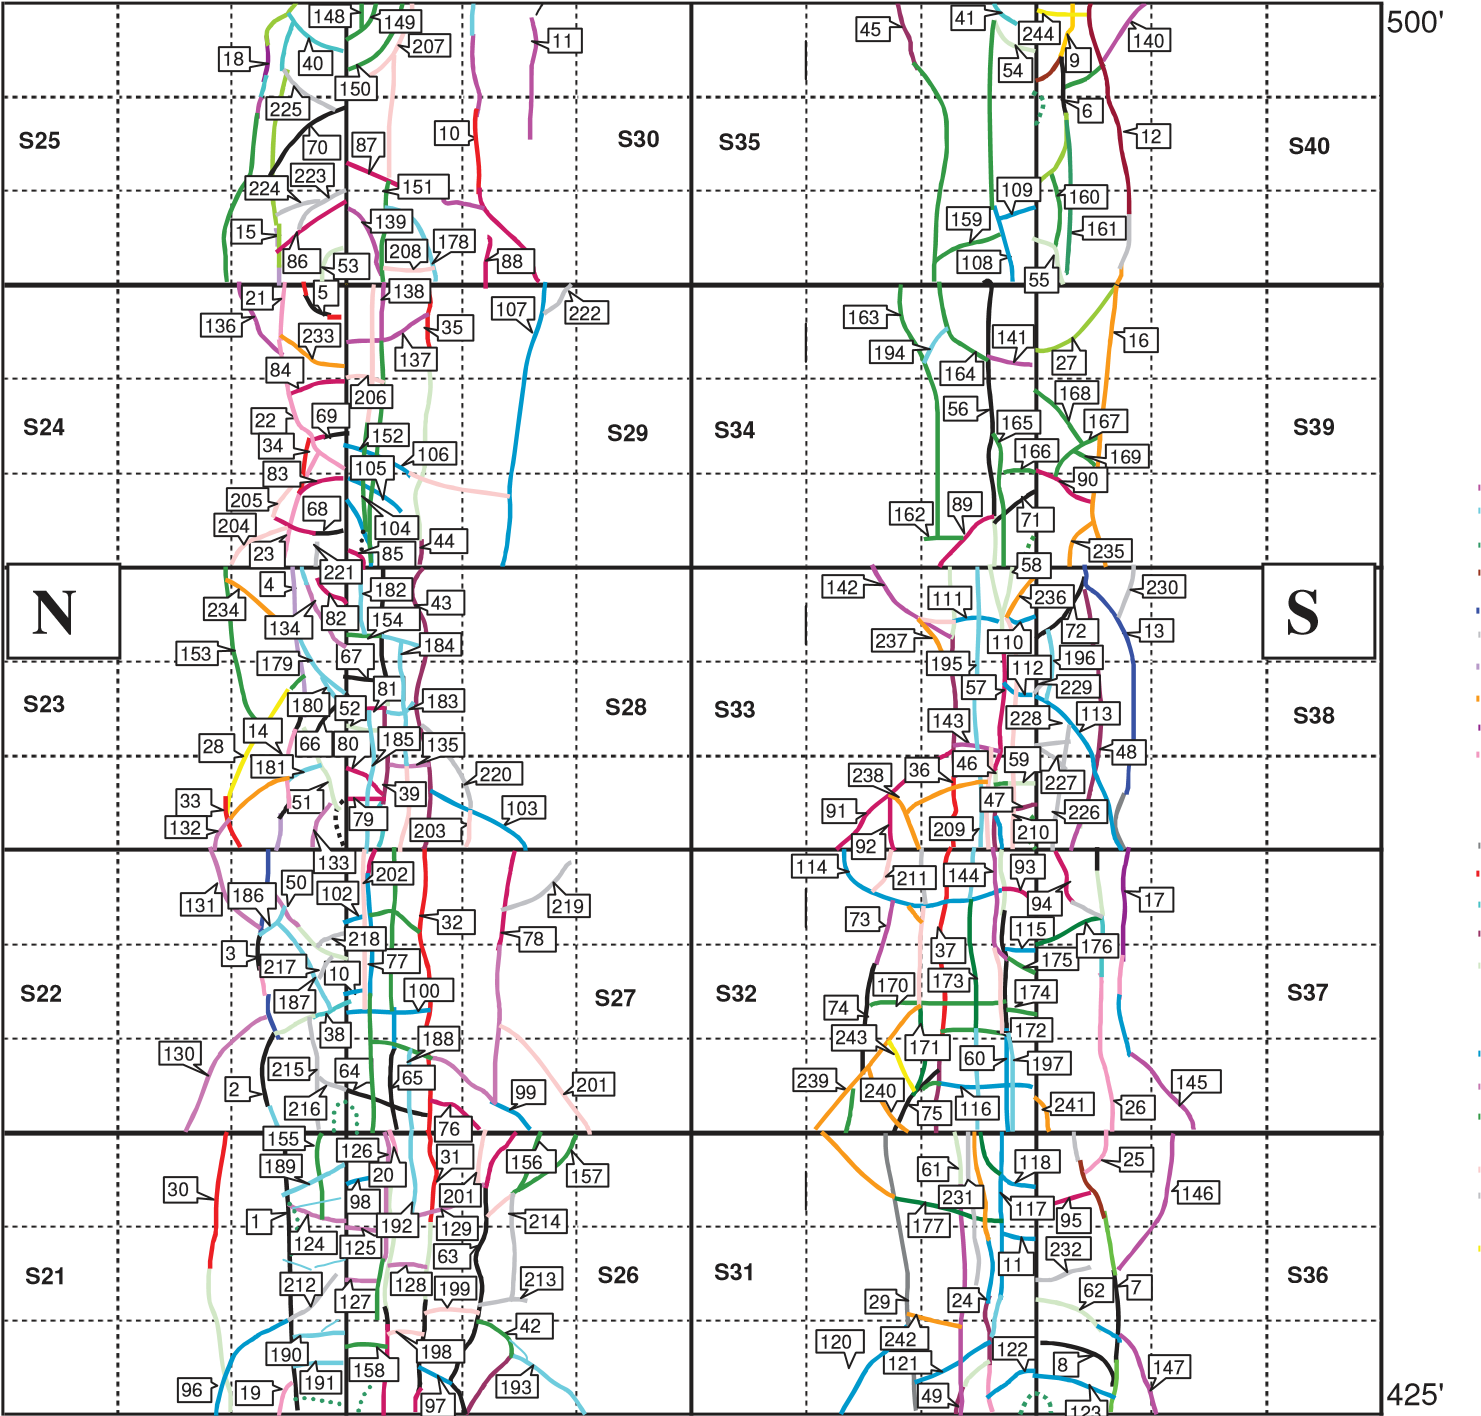
Figure 3. MRG Distress Map After 31,020 Passes on North Side (6-wheels) and 30,996 on South Side (4-wheels)
MRG and MRS were trafficked between July 6 and December 10, 2004. Distress maps were kept updated for each test item during trafficking with comments of significant events. The final distress maps for MRG and MRS are shown in Figures 3 and 4 respectively. Tables 2 and 3 present a summary of the significant events during trafficking of the MRG and MRS test items.
Table 2. Summary of Traffic Events for MRG Test Item
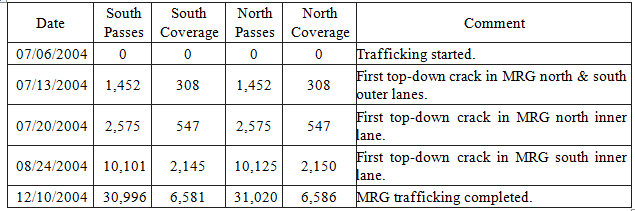
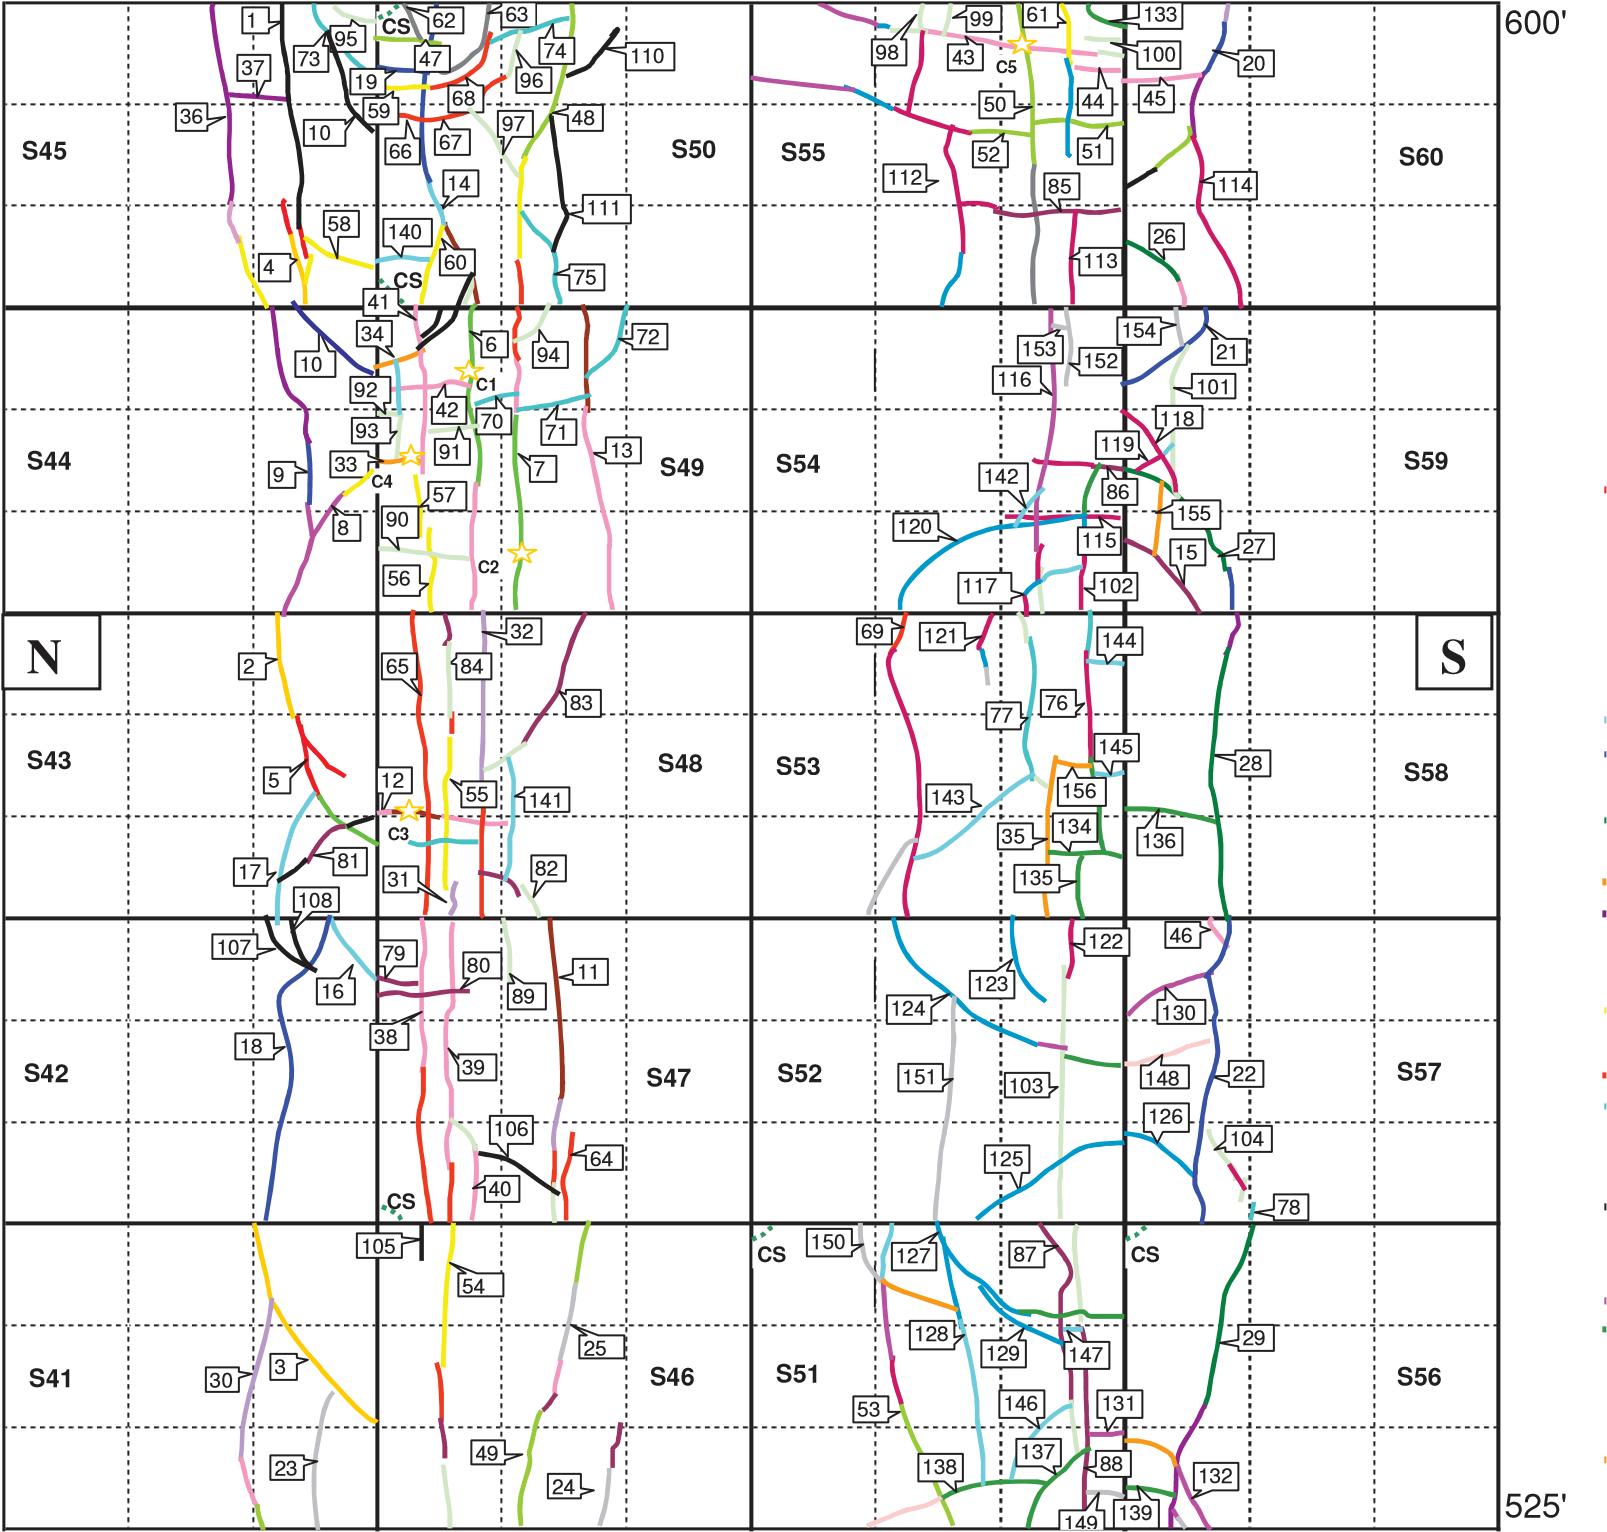
Figure 4. MRS Distress Map After 20,262 Passes on North Side (6-wheels) and 30,996 on South Side (4-wheels)
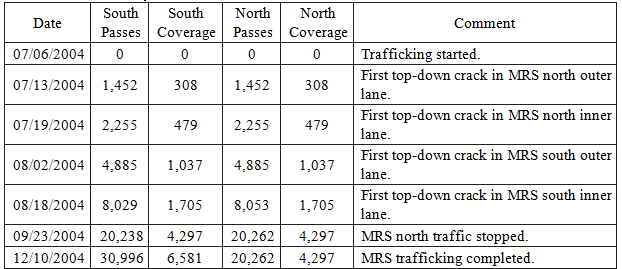
Table 3. Summary of Traffic Events for MRS Test Item
Click here to download (MSExcel) CC2 Test Items Pavement Distress Map Spreadsheet