CC1 Traffic Test Results & Analysis
The objectives of the CC1 Experiment were:
- Provide full scale test data to support new computer-based thickness design procedures then under development by the FAA.
- Provide full-scale pavement response and data for use in airplane landing gear design and configuration studies.
- Provide full-scale test data for re-evaluation of load repetition (alpha) factors used in the CBR method of design for flexible pavements.
For information on the Results and Analysis for the CC1 Experiment click on the links in the table below.
To be directed to the CC1 Database, click here.
To be directed to the CC1 Comprehensive Report, click here.
Rigid Pavement Traffic Test Results
The distresses observed in the rigid test items are presented in the figure below. In test item LRS, only four longitudinal cracks were observed after the initial 28 passes however, after additional traffic was applied corner cracks started to develop.
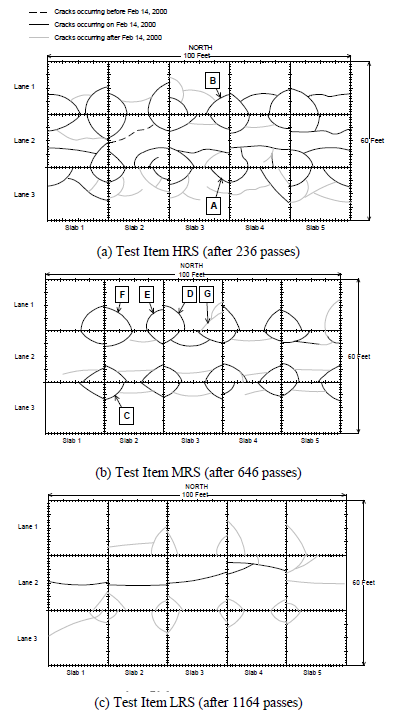
Crack Patterns in Rigid Test Items (Click to Zoom)
The figure below shows the definition of corner crack dimensions when reporting crack size. The “a” and “b” values were measured for the two sides of corner cracks and the average is presented in table below for different test items. The largest and smallest corner cracks developed in the HRS and LRS test items.
Elevation surveys were done shortly after the pavement construction and four days prior to the start of traffic testing. Each slab elevation was measured at nine points (four corners, four joints and one at the center). Analysis of the survey data revealed the presence of significant slab curling just prior to the start of traffic testing on February 14, 2000. The existence of curling was also verified by analyzing the HWD data at the centers, joints and corners of each slab. While curling was evident at the corners of all the pavement slabs, the HRS slabs exhibited the greatest amount of curling, and the LRS slabs exhibited the least amount of curling.
Indoor slabs were not exposed to typical field conditions such as sunlight exposure and temperature cycles. The measurements made after construction showed that the temperature gradients within the slabs were about one tenth of expected temperature gradients under typical field conditions. Therefore, it was concluded that the temperature gradient was not the major factor inducing upward curling. Drying shrinkage and large vertical moisture gradients within the slab depth were found to be the root cause of slab upward curling in CC1 rigid test items. These factors were more pronounced in the relatively thin slabs in test item HRS.

Definition of Corner Crack Dimensions (Click to Zoom)
|
Corner Crack Dimensions
|
Test Item
|
|
HRS
|
MRS
|
LRS
|
|
Average a, in. (cm)
|
78 (198)
|
72.5 (184)
|
54.9 (139)
|
|
Average b, in. (cm)
|
98.3 (250)
|
92.2 (234)
|
79.1 (201)
|
Summary of Average Crack Sizes for Rigid Test Items
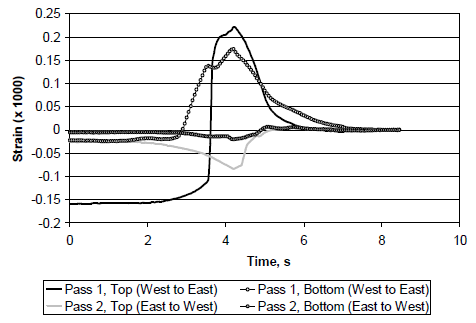
An analysis of the strain gauge data from the first phase of CC1 rigid pavement traffic testing was also performed. The figures below show a typical strain gauge response before crack initiation for the top and bottom sensor during passes 1 and 5 of the 4-wheel load. The peak strains for pass 1 are smaller than those from pass 5, because in pass 5 both tires were on the same side of the longitudinal joint, while in pass 1 the tires straddled the joint and only a portion of the wheel load was transferred through the joint.
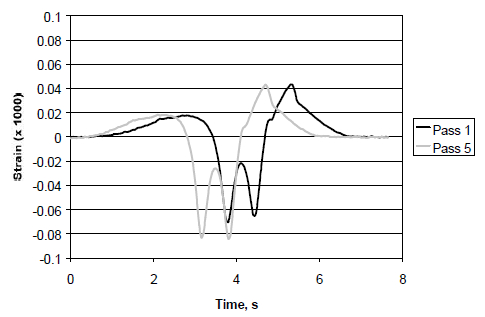
(a) Strain Gauge at Top of Slab (CSG – 303) (Click to Zoom)
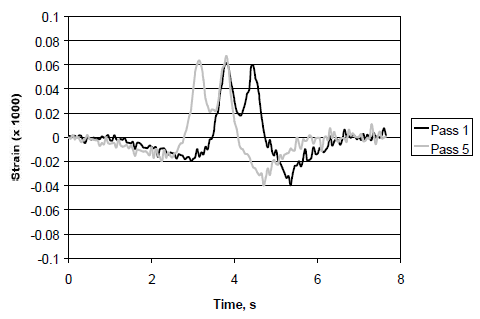
(b) Strain Gauge at Bottom of Slab (CSG – 366) (Click to Zoom)
The figures below show an example of strain gauge response in HRS, Lane 3 after the corner crack developed. The unusually high strain readings are attributed to the crack passing through the strain gauge location. It was verified that crack A initiated during the first pass of the vehicle implying a lack of structural support attributable to curling, rather than a fatigue failure. Similarly, the majority of corner cracks identified in the HRS item along lane 3 developed during the first vehicle pass. Similar analyses performed on strain gauges in the MRS and HRS test items showed that those slabs were subjected to high corner curling leading to early structure failure.
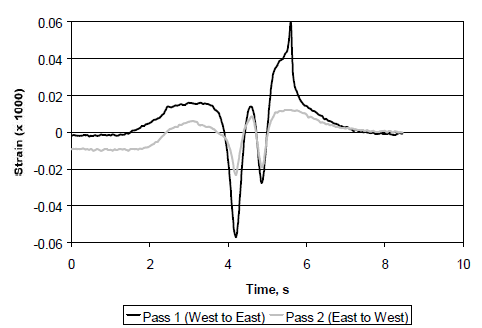
(a) Strain Gauge at Top of Slab, Longitudinal Joint (CSG – 109) (Click to Zoom)
(b) Strain Gauges at Top (CSG –173) & Bottom (CSG – 192) of Slab, Transverse Joint (Click to Zoom)
Flexible Pavement Static Response Test Results
The figure below shows a typical MDD response. Three axles are clearly defined by distinct peaks in the response. The peak strain increases significantly from the first wheel to the last wheel. The last wheel produces the maximum peak displacement. The difference between the initial response and the end response indicates unrecovered or permanent response. The unrecovered response was either negative (downward) or positive (upward) depending on the location of the wheel load in relation to the MDD.
In some cases, the time history was such that the total response was equal to the unrecovered response. The net unrecovered strain over a single wander cycle represents the incremental contributions to the permanent deformation accumulated over that wander cycle. When accumulated over the complete test to failure, these small increments of permanent deformation represent the total rut accumulation. The recovered displacement corresponds to the difference between peak and unloaded displacement. Recovered responses provide a good measure of the elastic behavior of pavement materials.
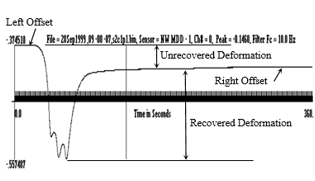
Typical Deflection Transducer Response from MDD for 6-Wheel Loading (Click to Zoom)
The figure below shows the recovered surface deflections for the flexible test items at a range of load levels. The LFC test item showed the highest deflection. The MFS test item had up to 10% higher recovered deflections compared to the MFC item. Test items HFS and HFC showed similar surface deflections.
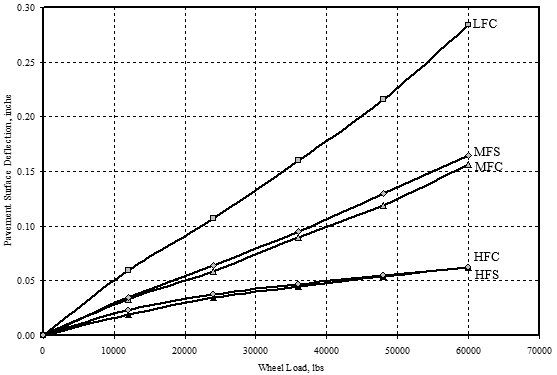
Recovered Surface Deflections from Static Load Tests for the Flexible Test Items (Click to Zoom)
The figure below shows the recovered subgrade deflections for the flexible test items except LFS at different load levels. Test item LFC showed the highest subgrade deflection. The difference in subgrade deflections between test items MFC and MFS became more with increasing load levels. Test items HFS and HFC showed almost similar subgrade deflections.
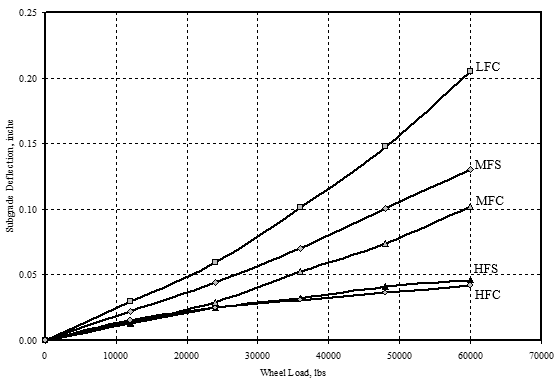
Recovered Subgrade Deflections for the Flexible Test Items from Static Load Tests (Click to Zoom)
As seen in the figure below shows the percentage of the total recovered deflection at the surface that was contributed by the subgrade layer for five of the six flexible test items. For test items LFC, MFC and MFS, the figure shows the stress softening behaviors. For test items HFC and HFS stress hardening of sandy soils is observed.
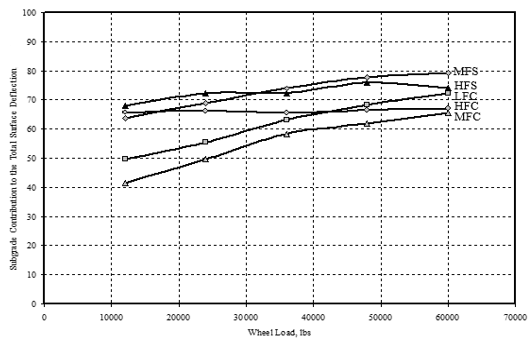
Subgrade Contribution to the Pavement Surface Deflection (Click to Zoom)
Flexible Pavement Traffic Test Results
Strain Gauges
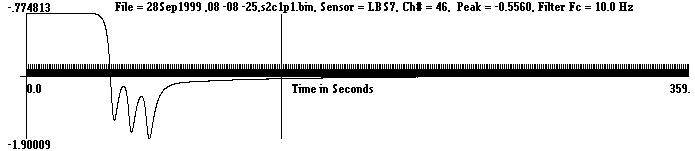
The figures below show a typical response signal for a longitudinal ASG with dual wheel loading and 6-wheel loading. After the axle had passed over the gauge, the strain level reduced rapidly with very little residual strain. In the case of 4- and 6-wheel loading,negative strain was always observed between axles.
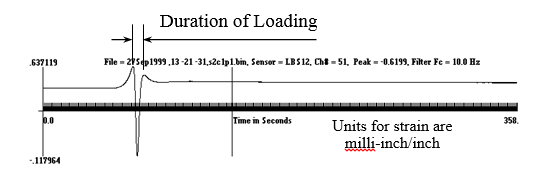
Longitudinal ASG Response Signal (Dual Loading) (Click to Zoom)
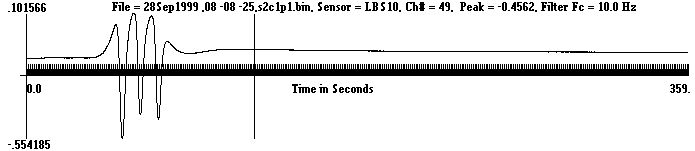
Longitudinal ASG Response Signal (6-Wheel Loading) (Click to Zoom)
The figures below shows a typical response signal from a transverse ASG subjected to a dual-wheel load and 6-wheel loading configuration. Positive strain readings gradually diminished to an asymptotic value as the load moved away from the gauge. Multiple axle loads resulted in higher residual transverse strain than single axle loads.
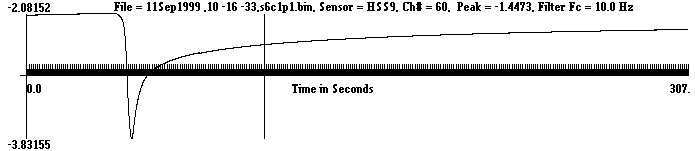
Transverse ASG Response Signal (Single Axle Load Gear) (Click to Zoom)
Transverse ASG Response Signal (6-Wheel) (Click to Zoom)
MDDs
The average subgrade vertical strains were estimated by measuring the simultaneous deflections with the MDDs at two levels in the subgrade, taking the difference between them and dividing by the vertical distance between the sensors. The relationship between recovered and unrecovered strains at different positions in the wander cycle was found by the time histories. Comparing the measured recovered and unrecovered deflections for both six- and four-wheel gears shows that the deflection contains a large fraction of the unrecovered deflection.
Both recovered and unrecovered strains increased significantly as the pavement structure deteriorated. Recovered strains were strongly dependent on the path of previously applied loads. The pavement response is strongly path dependent and that wander is an important component. Net unrecovered strain over a complete wander cycle was very small both in absolute terms and relative to the unrecovered strains at individual wander positions.
Flexible Pavement Slow-Speed Traffic Test
A series of additional traffic tests on high-strength subgrade test items were conducted in April 2000. The purpose of these additional tests was to gain data on the effect of vehicle speed on HMA layers. Tests were conducted at speeds of 0.25, 0.5, 0.75, 1.0, 2.0, 5.0, and 7.33 ft. /sec (0.08, 0.15, 0.23, 0.3, 0.6, 1.5, and 2.2 m/sec) and wheel loads of 24,000, 30,000, and 36,000 lbs. (106.8, 133.5, and 160.2 kN) at each speed. To investigate the effects of vehicle speeds, peak HMA strains in test item HFS were measured at various speeds.
The figures below show the peak AC strains measured for test item HFS from longitudinal and transverse ASGs, respectively. The difference in gauge measurements could be due to the position of gauge with respect to the wheel. However as it can be seen from the figures, in all the gauges higher speeds (lower load durations) result in lower strains. The rate at which measured strain reduces with speed, is higher at vehicle speeds lower than 2 feet/sec (0.6 m/sec).
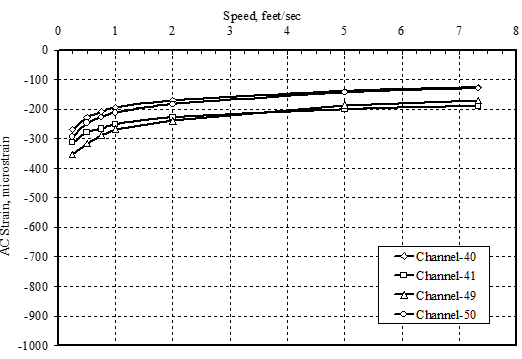
Peak AC Strains from Longitudinal ASGs for Test Item HFS (Test Date 4/20/00; Gauge Depth = 9.5 inches; Wheel Load = 36,000 lbs.)
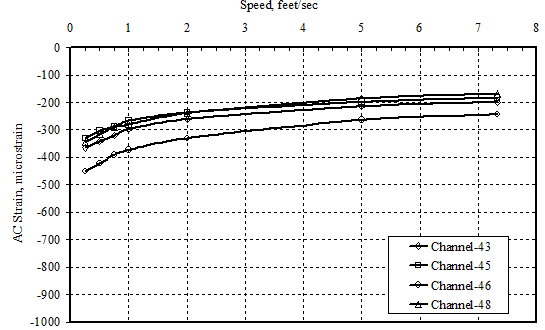
Peak AC Strains from Transverse ASGs for Test Item HFS (Test Date 4/20/00; Gauge Depth = 9.5 inches; Wheel Load = 36,000 lbs.)
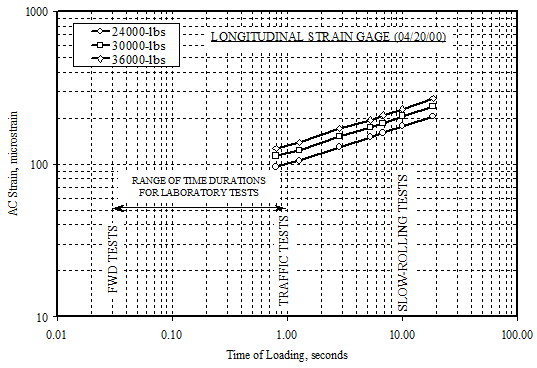
AC Strains – Time of Loading Relationship for Test Item HFS from Longitudinal ASGs (Test Date 4/20/00; Gauge Depth = 9.5 inches)
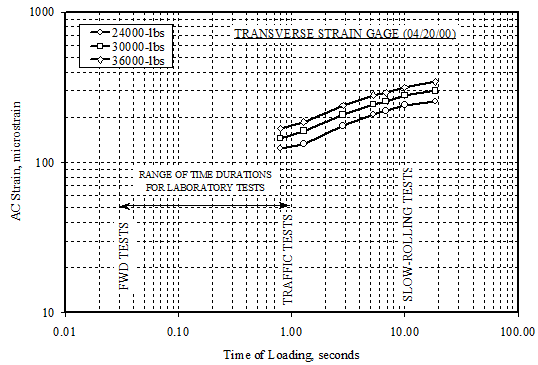
AC Strains – Time of Loading Relationship for Test Item HFS from Transverse ASGs (Test Date 4/20/00; Gauge Depth = 9.5 inches)
Conclusions
Based on the results of the CC1 Experiment, the key finds were:
Rigid Pavement
- MFC was the first test item to fail. Failure occurred after 12,000 passes. At failure, pavement surface was characterized by severe rutting between 2 and 6 inches.
- In MFS test item, localized failure was observed in the north side traffic path after 19,900 passes. The south side failed at 29,000 passes.
- The LFC and LFS showed few signs of structural failure after 20,000 passes. Therefore, the load level for LFS and LFC test items, was increased to 65,000 lbs. (29.4 tonnes) after 20,000 passes and the speed changed to 2.5 mph (4 km/h). In LFC and LFS test items, trafficking was stopped after 45,000 passes were completed.
- In HFC and HFS test items, tests were terminated after 5000 passes due to a determination that these pavement sections were unlikely to fail.
- Both recovered and unrecovered strains increased significantly as the pavement structure deteriorated for test items on low and medium strength subgrade.
- The total accumulated permanent deformation in the pavement structure over a complete wander pattern was a small fraction of the total range of the unrecovered deformation occurring during a typical wander cycle.
Flexible Pavement
- The ratio of D0 in the traffic lane to the D0 in the non-trafficked area was used as an indicator of structural damage. This value increased with applied traffic passes, and generally tracked the observed structural failures.
- For test items MFC and MFS, the ratio approached a value of 2 and pavement structural failure was observed.
- For test items LFS and LFC that did not fail structurally during traffic tests, the ratio did not exceed 1.7.
- For test item HFS, the measured strains were found to vary strongly with test speed. Higher vehicle speeds (longer duration of loading) resulted in reduced asphalt stiffness and higher measured strain values.
Return to Construction Cycle 1 Overview