CC8 Unbonded Overlay Test
The Unbonded Overlay Test was broken into two phases. The Phase 1 Overload Test consisted of the full scale construction and instrumentation of an aggregate base and Portland cement concrete (PCC) pavement. The Phase 2 Unbonded Overlay Test included the construction of an asphalt interlayer and overlay PCC pavement atop the post-test Phase I test pavement.
Test Objectives
The objective of the research effort was to develop new, rational overload criteria for airfield rigid pavements. Although the current ICAO overload criteria represent a “reasonable balance between operational flexibility and the need to avoid undue damage to pavements,” (Defence Estates 2011) it is still somewhat conservative and unsupported by empirical data. For example, limited Construction Cycle 6 (CC6) test data at the FAA’s NAPTF demonstrated that a one-time application of rupture load (i.e., equal to or exceeding the slab strength) did not necessarily shorten pavement life (Brill 2013). Ideally, allowable overload criteria would be linked to the Cumulative Damage Factor (CDF), which would then allow individual overloads to be related to consumed life.
Pavement Construction Cross Sections
The Overload Test area has two test items (north and south), is 60 feet long by 60 feet wide, and consists of twenty 12-foot by 12-foot slabs as shown in the figure below. The pavement structure consists of 9-inch thick concrete slabs on an 11-inch thick granular base on a prepared clay subgrade. Based on plate load tests, the modulus of subgrade reaction (k-value) was approximately 110 pci on the north test item, and 131 pci on the south test item. Since no stabilized base was used, this rigid pavement structure was considered representative of a non-hub or general aviation facility, i.e., not intended to handle heavy aircraft loads. All longitudinal joints were doweled with 0.75 inch diameter dowels. The transverse joints were not doweled.
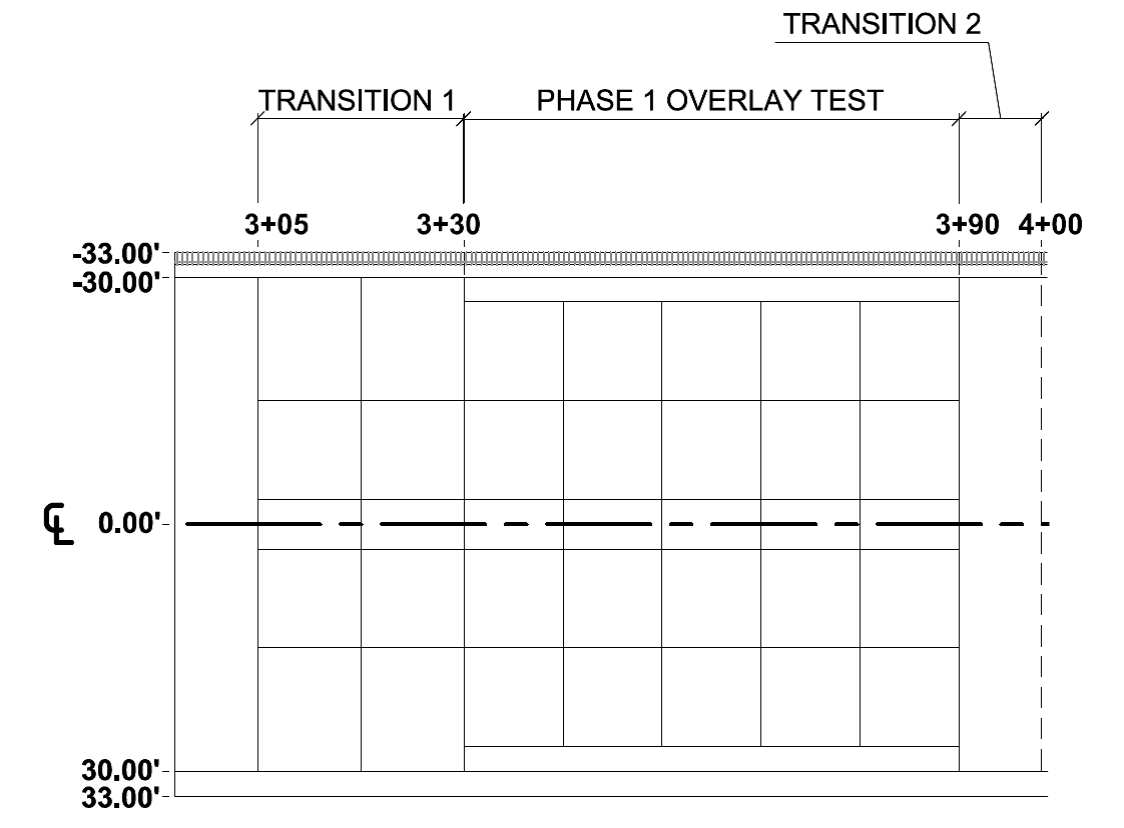
CC8 Phase 1 Overload Plan View [click here to view pdf (CC8 Ph 1 Plan.pdf)]
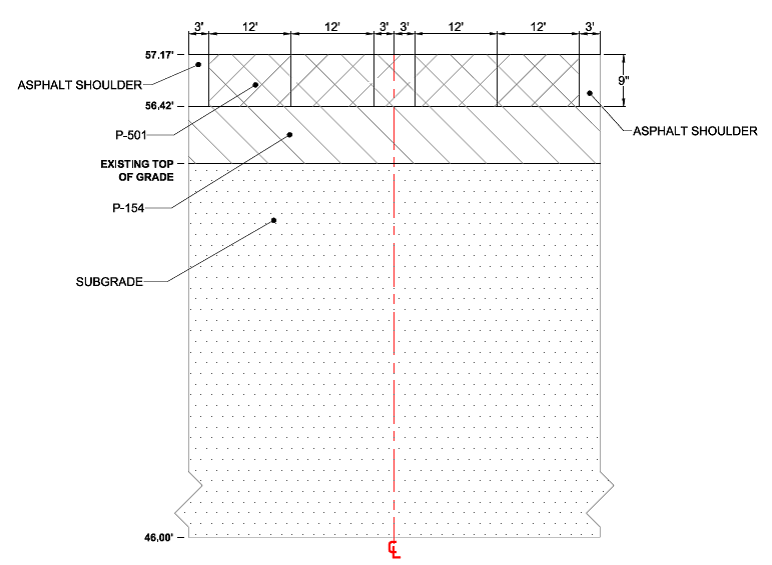
CC8 Phase 1 Overload Typical Section [click here to view pdf (CC8 Phase1 Plan.pdf)]
The P-152 subgrade target California Bearing Ratio (CBR) value range was 7-8. The procedure used to achieve the required results included tilling to a minimum depth of 8 inches to mix the material, monitoring moisture content, compacting the subgrade, making adjustments to the moisture content by watering or drying out the material until the target CBR value was achieved, and trimming to final grade. The final CBR subgrade values were 7.2 for the north side and 7.4 for the south side.
A P-154 granular subbase course was placed on the prepared subgrade. The constructed area was divided into 50 square yard sublots for testing purposes. Moisture, gradation, and density testing were conducted on each of the sublots to control the granular material and placement. The average density was 97%, and the average moisture content was 7.6%.
The total width of P-501 Portland cement concrete pavement was 54 feet. The effort started with setting the forms. There were two placements, spaced 7 days apart. The first placement was on Aug 13, 2015 and consisted of the two inner lanes, which included ten test slabs. The second placement was on Aug 20, 2015 and covered the center and two outer lanes. The steel dowels used measured 3/4 inch in diameter and 18 inches in length. They were placed at mid-thickness of the concrete and spaced at 12 inch centers in the longitudinal joints. The surface of the concrete was given a float finish after the screed was used in placing the concrete. Water soaked burlap was placed over the surfaces of the slabs at the end of the day. The burlap was then covered with plastic sheets to retain the moisture for curing the concrete over a 28-day period. Approximately 24 hours after each placement the saw cutting of the transverse joints took place. The process consisted of removing the burlap and plastic sheets, surveying the joint locations, marking the joints with a string line and paint, and then sawing the joints. All transverse joints were cut at one-third the depth of the slab (D/3), or 3 inches.
Traffic Test Results
On February 22, 2016, an initial set of 66 passes of a dual (D) gear configuration with a 20,000 pounds per wheel design load was used to complete one wander pattern on the test pavement. Following this initial wander pattern, five overload wander patterns (330 passes total) of incrementally increasing dual tandem (2D) gear loads were applied. No cracks were observed, either visibly on the surface, or by evidence of strain gage responses. It was then decided to increase the wheel load. The revised overload test was executed on February 25 and 26, 2016. A per-wheel load of 28,000 pounds was used for normal traffic, and followed by revised overloads.
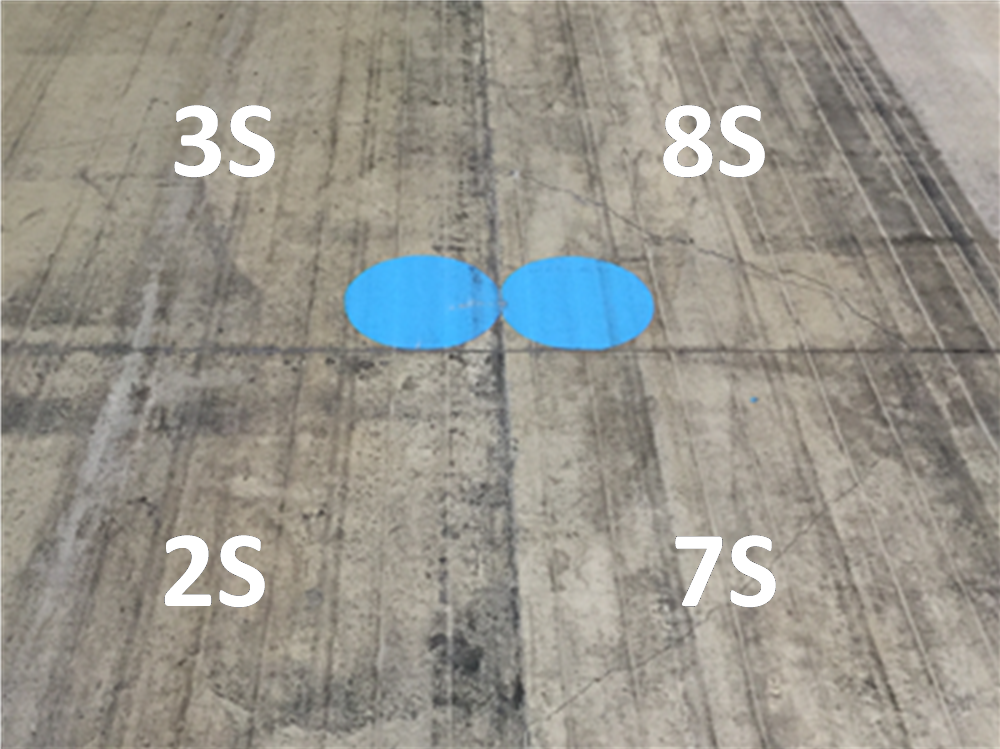
Traffic testing was stopped on March 2, 2016 after 4,422 normally loaded passes at the increased wheel load level were completed. A number of distresses were observed on the south test item near the transverse joint at Sta. 3+54, which caused the Structural Condition Index (SCI) value to drop from 100 to 68. The observed distresses were:
· 1 shrinkage crack on Slab 2S
· 1 low severity diagonal crack and 1 low severity corner spall on Slab 3S
· 1 low severity corner break on Slab 7S
· 1 medium severity corner break on Slab 8S
A photograph of the damaged pavement is shown below. Examination of the distress patterns suggested the development of cracking near the slab surface as a result of tensile stresses due to slab counter-flexural bending.
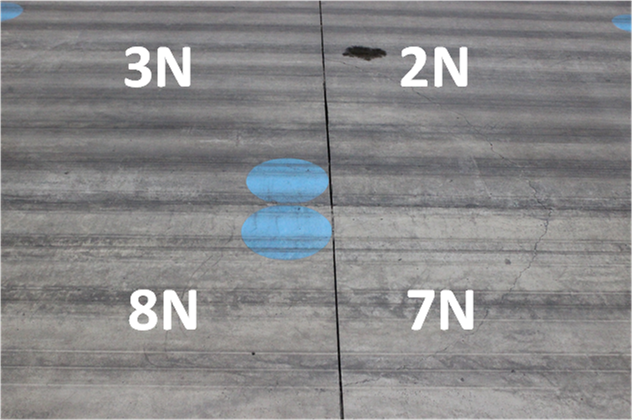
After a rest period of approximately six months, traffic resumed on the north test item only (September 14, 2016). Traffic on the north test item was stopped on September 19, 2016 after completion of 7,788 normally loaded passes with a wheel load of 28,000 pounds (1,320 passes at the original normal load, plus 6,468 passes at the increased normal wheel load). A number of distresses were found on the south test item near the transverse joint at Sta. 3+54, causing the SCI value to drop from 100 to 79. The observed distresses were:
· 1 low severity corner break on Slab 2N
· 1 low severity corner break on Slab 7N
· 1 low severity corner break on Slab 8N
A photograph of the damaged pavement is shown below. Similar to the south test item, the distresses observed in the north test item were consistent with top-down cracking.
Analysis of Test Results
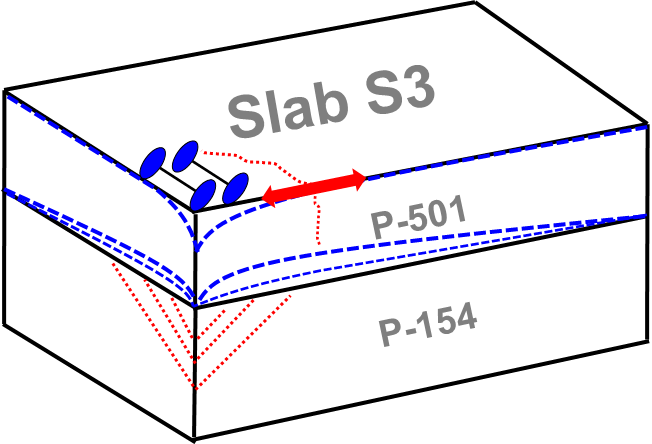
The observed distresses are the result of wheel load repetitions at slab corners that cause corner deflections and stresses in the top surface of the slab, resulting in fatigue damage and ultimately cracking. It is important to note that the top-down cracks did not occur under the action of the overloads themselves; rather, the overloads provided the opportunity for fatigue damage to take place earlier than it would otherwise. The magnitude and frequency of loads, the support conditions at slab corners, the uniformity of the subbase, and the degree of joint load transfer, all combine to permit excessive downward corner deflections. As the corner becomes progressively less supported and experiences correspondingly higher deflections and stresses under loads, distresses occur along the outer edge of the slab. A graphic demonstration of such localized failure is given in below figure. Hypothetically, a stronger support from underlying layers (e.g., stabilized subbase) would provide protection against the observed distresses at slab corners.
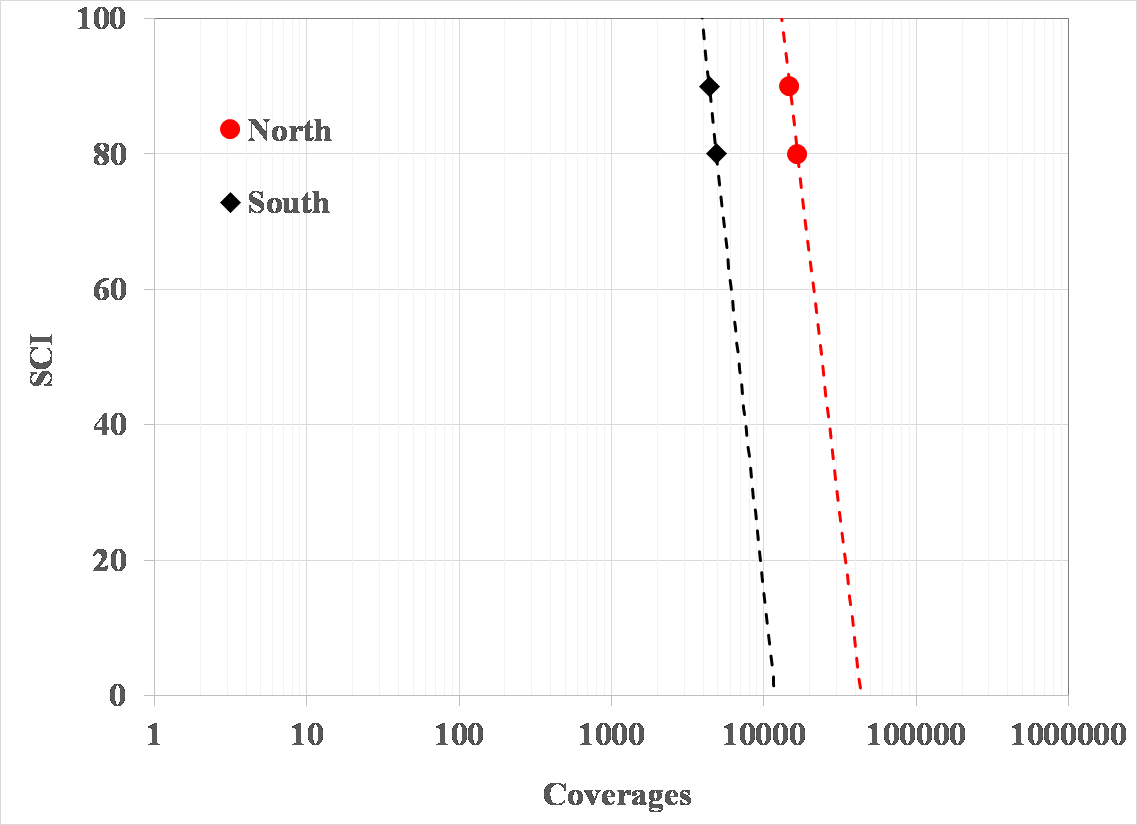
In below figure, the structural deterioration for both test items are plotted versus cumulative coverages on a logarithmic scale to correspond to traditional plotting of fatigue relationships. This performance curve is a key product of this research effort, and two important observations can be obtained from it. At the same reference load level, overloads considerably shortened pavement fatigue life up to the first full-depth crack (i.e., at which SCI just begins to diminish from its initial level of 100). In addition, Figure 27 suggests that overloads did not affect the rate of structural deterioration (slope of the falling leg of the SCI-vs-log(C) curve).
Conclusions
To evaluate the ICAO overload criteria for rigid pavements, a concrete pavement was constructed, instrumented, and tested at the FAA NAPTF. The test pavement consisted of a 9-inch thick PCC surface layer and 11-inch thick aggregate subbase on a processed clay subgrade. Traffic testing began in February 2016 and ended in September 2016. This report provides details of the CC8 Phase 1 Overload experiment. Key findings are:
· The observed distresses are the result of wheel load repetitions at slab corners causing corner deflections and stresses in the top surface of the slab, resulting in fatigue damage and ultimate cracking.
· The fatigue failure of the overloaded slabs was accelerated because heavy wheel loads compressed the aggregate base, thereby opening a void space under the slab and providing the opportunity for top-down cracking. These results suggest that the use of stabilized bases under rigid pavements may provide benefit in the form of additional tolerance of occasional overloads, i.e., beyond the limit currently established by ICAO (5% above PCN for rigid pavements).
· Overloads considerably shortened pavement fatigue life up to the first full-depth crack (i.e., at which SCI just begins to diminish from its initial level of 100).
· Overloads did not affect the rate of structural deterioration (slope of the falling leg of the SCI-vs-log(C) curve).
For more information on the Construction Cycle 8 Phase 1 Overload Experiment click on one of the links in the table below.
To be directed to the CC8 Phase 1 Database, click here.
Construction
Traffic Testing
Return to Construction Cycle 8 Overview