CC8 Phase 1 Overload Traffic Test Results & Analysis
Objectives
One of the objectives of the CC8 Phase 1 Overload and Phase 2 Overlay Test was to evaluate a PCC overlay on an existing PCC with Structural Condition Index (SCI) in the 50-80 range. The specified SCI range was intended to fill significant gaps in data from previous NAPTF rigid overlay tests (CC4), which considered only new (SCI = 100) and highly deteriorated (SCI = 40) base pavements.
The second objective was to perform full-scale tests which would be utilized to develop rational overload criteria for rigid pavements. The results would be compared to the current International Civil Aviation Organization (ICAO) Annex 14 criteria, allowing occasional overload by aircrafts with an aircraft classification number up to 5% the reported pavement classification number.
Traffic Test Results
On February 22, 2016, an initial set of 66 passes of a dual (D) gear configuration with a 20,000 pounds per wheel design load was used to complete one wander pattern on the test pavement. Following this initial wander pattern, five overload wander patterns (330 passes total) of incrementally increasing dual tandem (2D) gear loads were applied. No cracks were observed, either visibly on the surface, or by evidence of strain gage responses. It was then decided to increase the wheel load. The revised overload test was executed on February 25 and 26, 2016. A per-wheel load of 28,000 pounds was used for normal traffic, and followed by revised overloads.
Traffic testing was stopped on March 2, 2016 after 4,422 normally loaded passes at the increased wheel load level were completed. A number of distresses were observed on the south test item near the transverse joint at STA. 3+54, which caused the Structural Condition Index (SCI) value to drop from 100 to 68. The observed distresses were:
- 1 shrinkage crack on Slab 2S
- 1 low severity diagonal crack and 1 low severity corner spall on Slab 3S
- 1 low severity corner break on Slab 7S
- 1 medium severity corner break on Slab 8S
A photograph of the damaged pavement is shown below. Examination of the distress patterns suggested the development of cracking near the slab surface as a result of tensile stresses due to slab counter-flexural bending.
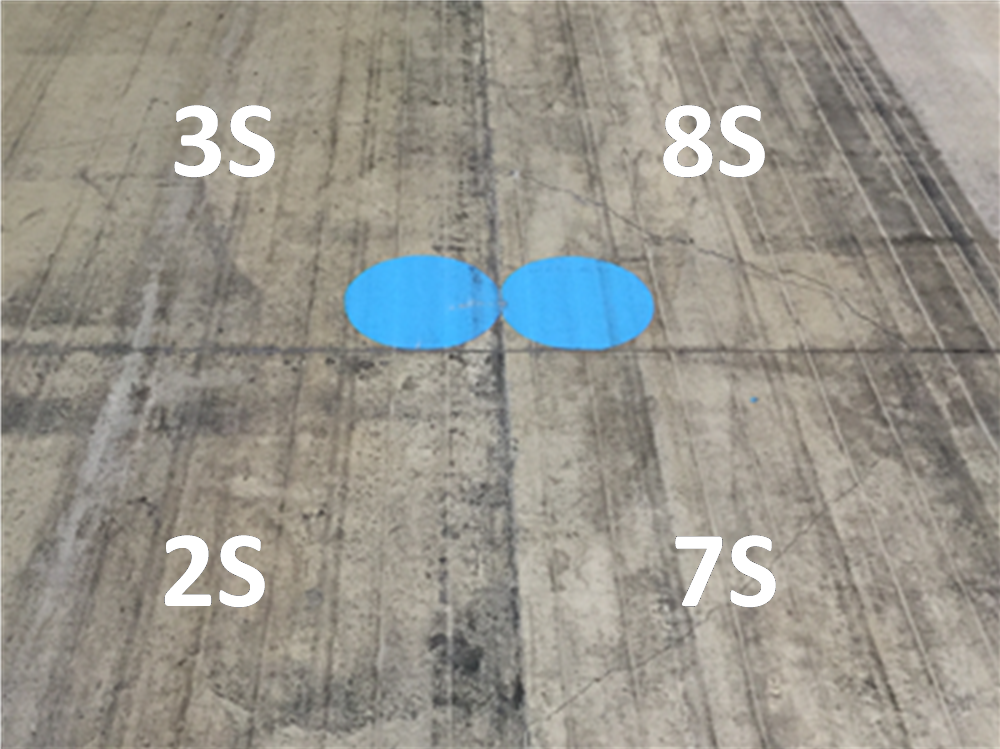
CC8 Phase 1 Overload South Pavement Distresses (Click to Zoom)
After a rest period of approximately six months, traffic resumed on the north test item only (September 14, 2016). Traffic on the north test item was stopped on September 19, 2016 after completion of 7,788 normally loaded passes with a wheel load of 28,000 pounds (1,320 passes at the original normal load, plus 6,468 passes at the increased normal wheel load). A number of distresses were found on the south test item near the transverse joint at STA. 3+54, causing the SCI value to drop from 100 to 79. The observed distresses were:
- 1 low severity corner break on Slab 2N
- 1 low severity corner break on Slab 7N
- 1 low severity corner break on Slab 8N
A photograph of the damaged pavement is shown below. Similar to the south test item, the distresses observed in the north test item were consistent with top-down cracking.
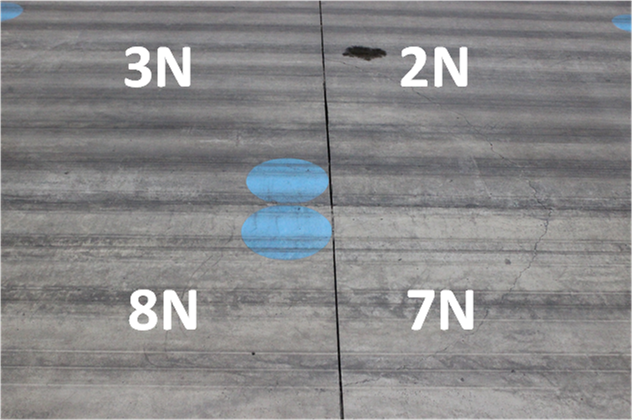
CC8 Phase 1 Overload North Pavement Distresses (Click to Zoom)
Analysis of Test Results
Bearing Capacity
Bearing Capacity Analysis using a KUAB Model 150 tester with a four-drop loading sequence beginning with an approximate 12,000-lb seating load followed by loads of 4,700 lbs., 8,000 lbs., and 12,000 lbs.
Slab Center Deflections
Deflections at the highest HWD load levels (12,000 lbs.) illustrated that the pressure exerted by the wheel loads distributed to the subbase and subgrade was relatively low and mostly carried by the concrete slabs. In addition deflections increased as the traffic testing. Based on the south test item, the traffic induced deterioration primarily occurred at the shallow depth for the south test items. As for the north test items, some damage accumulated in deeper layers during trafficking.
In addition to visual examination of deflection basins, deflection basin area (AREA), and impulse stiffness modulus (ISM) were used to characterize the pavement strength. Neither AREA nor ISM provided consistent indication of the decrease of bearing capacity due to traffic loads.
Slab Corner Deflections
Corner HWD deflections at the highest HWD load level (12,000 lbs.) were analyzed to evaluate the impact of traffic loads on slab corners. The south test items showed little evidence of corner deterioration based on HWD. High deflections along certain areas were possibly due to significantly reduced load transfer due to complete formation of the transverse joint at Sta. 3+54 as a result of temperature-induced contraction. The post-traffic deflection basins at the same four slab corners indicate severe damage in the concrete slabs that were not able to effectively transfer the loads to underlying layers.
Void Detection
One important characteristic of concrete pavements is the slab support conditions. The occurrence of surface distresses such as corner breaks, joint faulting, and slab cracking, can be resulted from a loss of support. The maximum corner deflections (D0) from three HWD load levels for the south and north test item were analyzed pre and post trafficking. By the completion of traffic testing a deflection intercept greater than 5 mils was observed at certain slab corners, indicating a loss of support beneath the slab. The loss of support may have been due to the presence of a void caused by the settlement under the P-501 layer.
In-Situ Modulus Analysis
Instrumentation Response Analysis
Concrete temperatures were monitored by the thermocouples installed at three depths in the P-501 layer: bottom, middle, and surface. As shown in the figure below, the highest concrete temperature was recorded about 20 hours after pouring, 111oF. Afterwards, the slab temperature started to drop due to the reduction of the heat from hydration. Assuming a linear interpolation between the bottom and surface temperatures, the maximum thermal gradient of 0.28oF/in was recorded at 14:00, 03/01/2016.
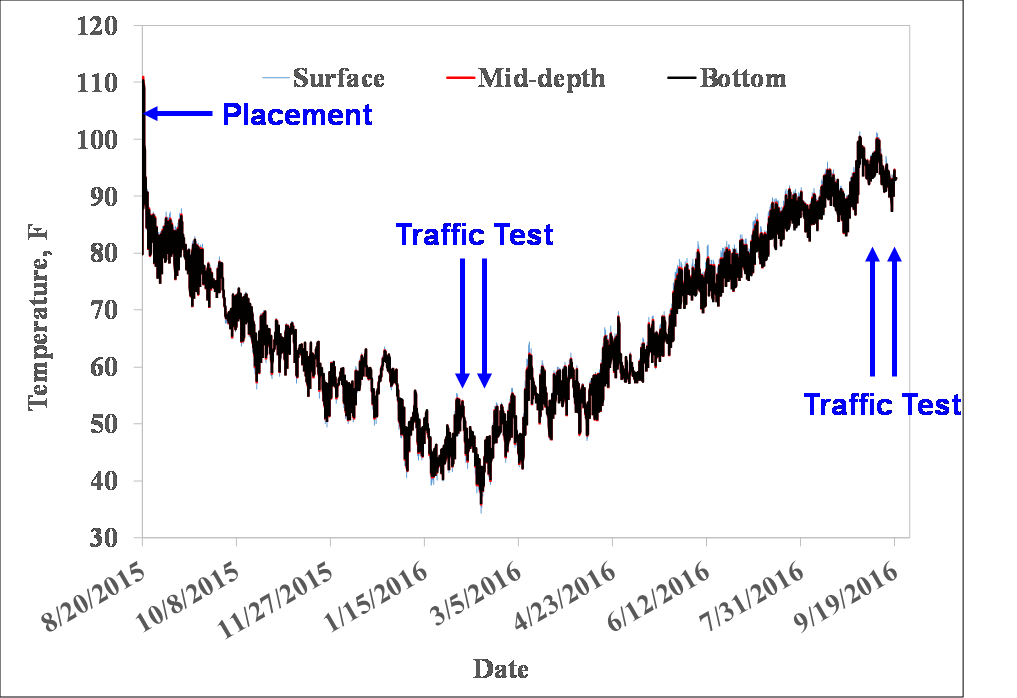
CC8 Phase 1 Overload Concrete Temperature (Click to Zoom)
Four embedded strain gauge were used to monitory pavement responses during the traffic test, specifically capturing both top-down and bottom-up crack initiation. Compared to the normal traffic, the overloads induced a higher peak tensile strain at the slab surface and smaller peak tensile strains at the bottom of the slab.
For the south test item, the tensile strains at the slab bottom were always higher than those on the surface. Neither of the gage responses indicated a crack initiation. For the north test item, the initial tensile strains at the slab bottom were much higher than those on the surface. There was also a distinct jump in the responses due to the increase of wheel load from 20,000 lbs. to 28,000 lbs. The application of overloads seemed to have a minimal effect in strain responses.
Two ECS sensors were installed on a trial basis on the south test item only. The figure below illustrates peak deflections from two sensors against the accumulated load passes. In both cases, peak downward deflections at slab corners increased rapidly under the overload traffic, then gradually recovered under subsequent normal traffic. At failure, there was a sudden drop in peak deflection response (over 20 mils), suggesting that the developing cracks had destroyed the slab flexure completely.
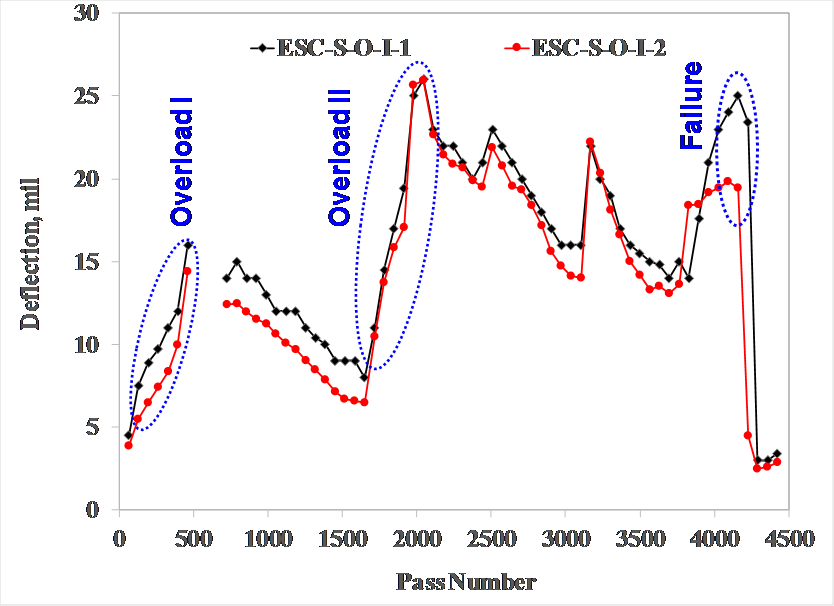
CC8 Phase 1 Overload ECS Sensor Deflections (Click to Zoom)
Failure Mechanism
The observed distresses are the result of wheel load repetitions at slab corners that cause corner deflections and stresses in the top surface of the slab, resulting in fatigue damage and ultimately cracking. It is important to note that the top-down cracks did not occur under the action of the overloads themselves; rather, the overloads provided the opportunity for fatigue damage to take place earlier than it would otherwise. The magnitude and frequency of loads, the support conditions at slab corners, the uniformity of the subbase, and the degree of joint load transfer, all combine to permit excessive downward corner deflections. As the corner becomes progressively less supported and experiences correspondingly higher deflections and stresses under loads, distresses occur along the outer edge of the slab. A graphic demonstration of such localized failure is given in the figure below. Hypothetically, a stronger support from underlying layers (e.g., stabilized subbase) would provide protection against the observed distresses at slab corners.
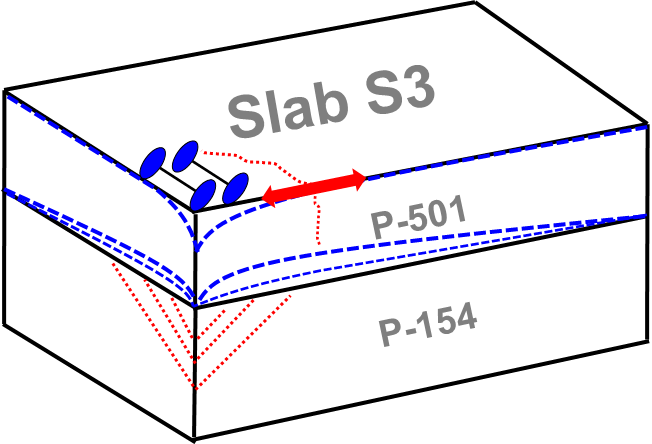
Failure Mechanism (Click to Zoom)
Overload Effects
In the figure below, the structural deterioration for both test items are plotted versus cumulative coverages on a logarithmic scale to correspond to traditional plotting of fatigue relationships. Two important observations can be obtained from it. At the same reference load level, overloads considerably shortened pavement fatigue life up to the first full-depth crack (i.e., at which SCI just begins to diminish from its initial level of 100). In addition, the figure suggests that overloads did not affect the rate of structural deterioration (slope of the falling leg of the SCI-vs-log(C) curve).
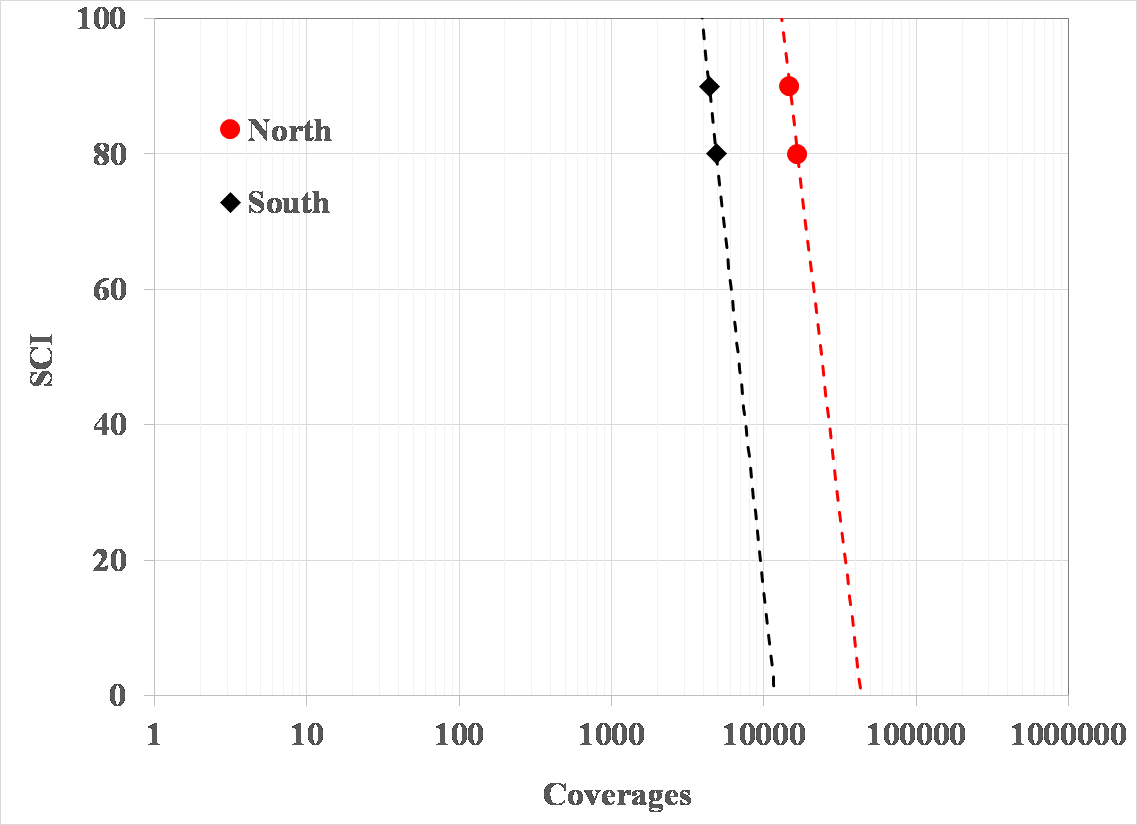
SCI as a Function of Coverages (Click to Zoom)
Conclusions
Based on the results of the CC8 Phase 1 Overload Test, the key finds were:
- The observed distresses are the result of wheel load repetitions at slab corners causing corner deflections and stresses in the top surface of the slab, resulting in fatigue damage and ultimate cracking.
- The fatigue failure of the overloaded slabs was accelerated because heavy wheel loads compressed the aggregate base, thereby opening a void space under the slab and providing the opportunity for top-down cracking. These results suggest that the use of stabilized bases under rigid pavements may provide benefit in the form of additional tolerance of occasional overloads, i.e., beyond the limit currently established by ICAO (5% above PCN for rigid pavements).
- Overloads considerably shortened pavement fatigue life up to the first full-depth crack (i.e., at which SCI just begins to diminish from its initial level of 100).
- Overloads did not affect the rate of structural deterioration (slope of the falling leg of the SCI-vs-log(C) curve).
Additional Resources
To be directed to the CC8 Phase 1 Overload Test Database, click here.
To be directed to the CC8 Phase 1 Overload Comprehensive Report, click here.
Return to Construction Cycle 8 Overview