CC8 Phase 2 Overlay Traffic Test Results & Analysis
Objectives
One of the objectives of the CC8 Phase 1 Overload and Phase 2 Overlay Test was to evaluate a PCC overlay on an existing PCC with Structural Condition Index (SCI) in the 50-80 range. The specified SCI range was intended to fill significant gaps in data from previous NAPTF rigid overlay tests (CC4), which considered only new (SCI = 100) and highly deteriorated (SCI < 40) base pavements.
The second objective was to perform full-scale tests which would be utilized to develop rational overload criteria for rigid pavements. The results would be compared to the current International Civil Aviation Organization (ICAO) Annex 14 criteria, allowing occasional overload by aircrafts with an aircraft classification number up to 5% above the reported pavement classification number.
Traffic Test Results
On October 10, 2017, traffic testing was conducted using the NAPTV with a 3D gear configuration for the north test item and 2D for the south test item. The test was performed on both test items at a wheel load of 55,000 pounds, vehicle speed of 2.5 mph and nominal tire pressure of 220 psi. The wander pattern consisted of 66 passes.
The initial goal for the traffic test was to achieve a single digit SCI on both the north and south test items. The traffic test started on October 10, 2017. The traffic test was terminated in the south test item on January 11, 2018 after a total of 29,370 vehicle passes were completed and a SCI value of 8 was attained. Traffic continued in the north test item until a SCI value of 11 was achieved on February 1, 2017 after a total of 37,290 vehicle passes were applied.
Behavior of Test Section under Traffic
Distress Mapping
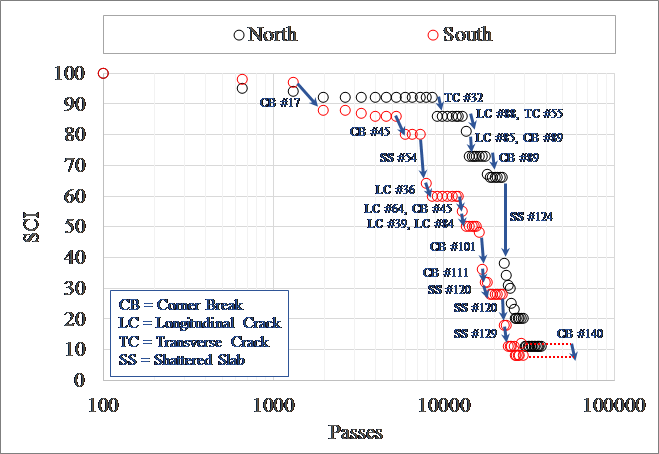
The pavement distress survey performed on CC8 Phase 2 illustrated that during the early stage of the traffic test, tight surface cracks isolated in the interior of slabs and developed in a random pattern, were observed in the north test item. In general, the south test item showed structural cracks and failed earlier than the north. Also, more corner breaks were observed on the south test item compared to the north. On both test items, corner breaks and longitudinal cracks were the dominant distress types. Development of reflective cracking from the underlay longitudinal joints was observed within the trafficked area on both test items.
SCI Evaluation
The SCI Evaluation of the CC8 Phase 2 illustrated below shows that the deterioration in the south test item is evidently faster than the north. The total number of vehicle passes required to achieve similar levels of deterioration upon traffic termination was 37,290 for the north test item whereas only 29,370 for the south test item. Under comparable structural conditions the north test item would be expected to fail first given that the 3D gear configuration is 50% heavier than the 2D used in the south.
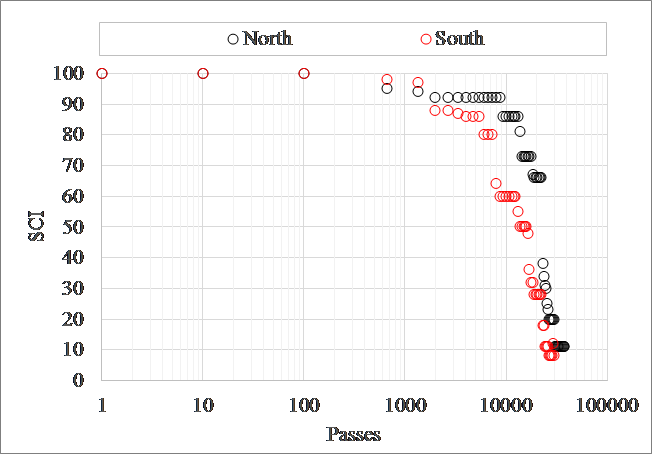
CC8 Phase 2 Overload SCI versus Pass (Click to Zoom)
Analysis of Test Results
Thermocouple Data (T)
The temperature fluctuation at top of the overlay decreased with depth. Also, a slight difference in temperature was observed between north and south thermocouples. An average temperature differential of -0.5°F evidenced that the north test item remained slightly colder than the south throughout the traffic test. This is because the south wall of the building is more exposed to sunlight than the north.
Embedded Strain Gauge Data (EG)
The typical response of the EGs was monitored during the first ten wanders of the traffic test. As anticipated, the critical tensile response in the EGs located near the bottom of the overlay was observed when the outer wheel in either carriage passed directly over the gage.
·
-
Performance Measure using Crack Density
In addition to SCI, the crack density parameter (CD) was used to quantify the performance of concrete overlay (2, 3). An apparent decrease in the rate of change in CD occurred after approximately 23,000 vehicle passes. A side-by-side comparison between the changes in SCI and CD is given in the figure below. As anticipated, the CD increases with decreasing SCI.
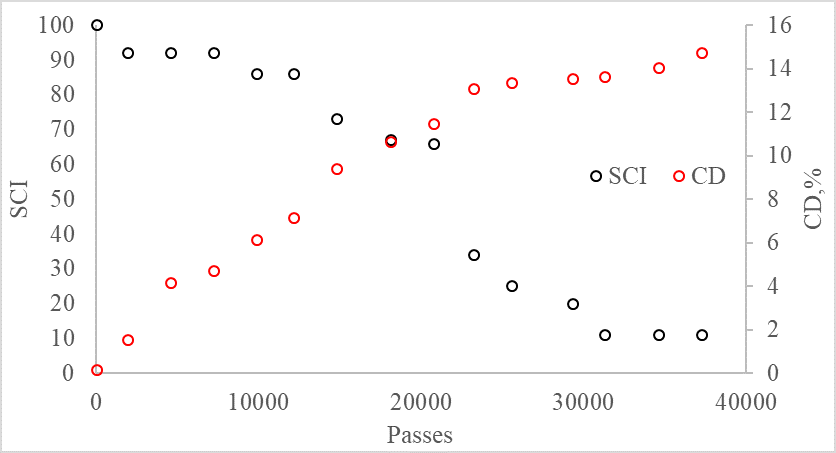
CC8 Phase 2 Overload SCI versus CD on North (Click to Zoom)
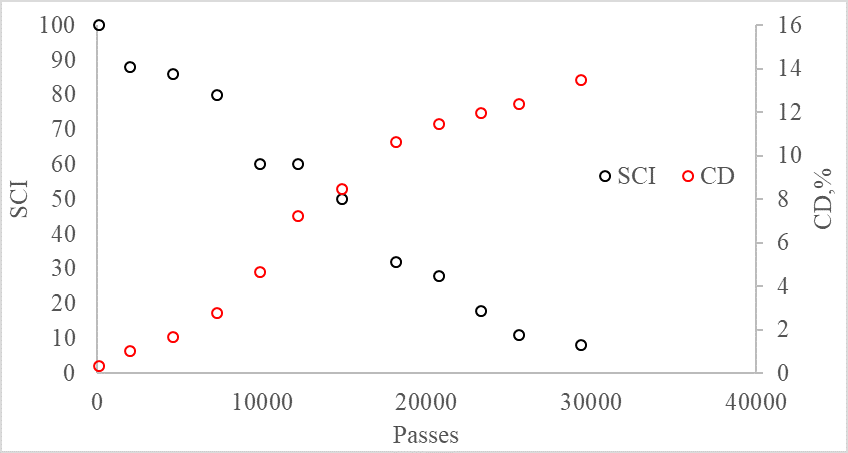
CC8 Phase 2 Overload SCI versus CD on South (Click to Zoom)
-
Correlation between Strain Response and Local Distresses
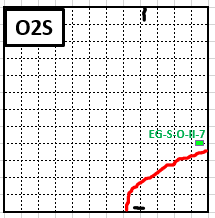
The maximum strain responses from multiple sensors showed significant changes during the traffic test. The figures below shows sharp drops in the responses of EG-S-O-II-7 and EG-S-O-II-8 took place during the third day of trafficking and the occurrence of a corner break was reported in the distress survey.
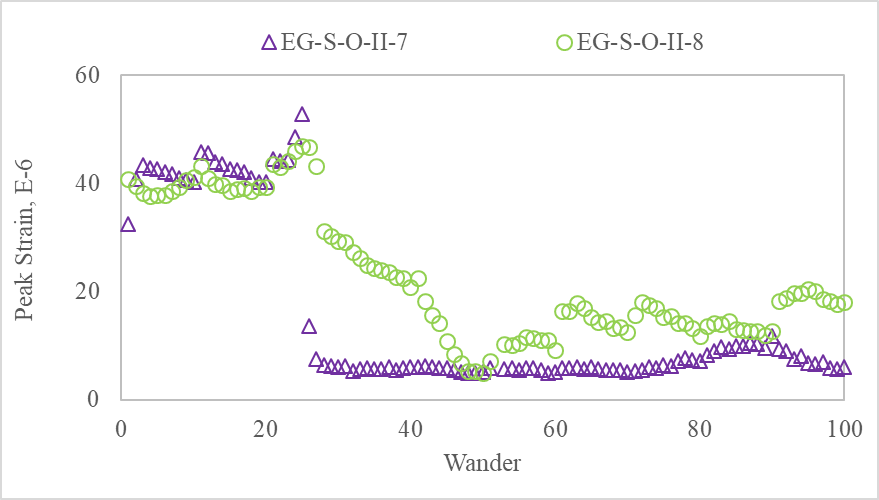
CC8 Phase 2 Overlay Peak Strains (Click to Zoom)
CC8 Phase 2 Overlay Corner Breaks on 3rd Day of Trafficking (Click to Zoom)
-
T/C Ratio (Tensile/Compressive Strain Ratio)
The relative change in peak tensile and compressive strains was evaluated by the T/C ratio. In general, the peak tensile strains were much higher than the peak compressive strains. The T/C ratio for the top sensors tended to increase over the course of traffic test, whereas the ratio for the bottom sensors decreased. This observation suggests increasing tensile stresses at the pavement surface and therefore potential dominance of top-down cracking.
·
-
NAP (Neutral Axis Position)
The possibility of neutral axis shifting was evaluated. The neutral axis position NAP relative to the bottom of the slab was computed based on both the compressive and tensile strains, and their distance from the neutral axis. In general, the initial overlay NAP (first wander) was observed to be slightly below the mid-depth, suggesting a possible bonded condition between the asphalt interlayer and overlay. As expected for unbonded PCC overlays, a strain reversal was observed at the interface above and beneath the interlayer. The effect of traffic induced damage in the overlay was reflected not only by the NAP downward shifting but also by the reduction in strain response (last wander) captured by both top and bottom EGs.
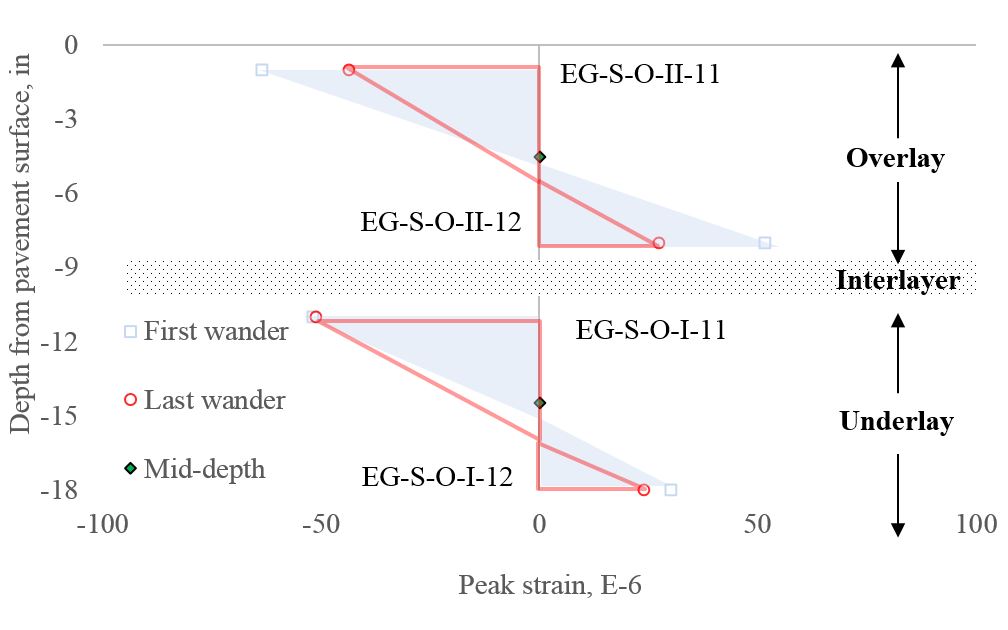
CC8 Phase 2 Overlay NAP Downward Translation (Click to Zoom)
Eddy Current Sensor Data (ECS)
The typical response of the ECS was monitored during the first ten wanders of the traffic test. As anticipated, the critical deflection response in the ECSs was observed when the outer wheel in either carriage passed directly over the sensor.
·
-
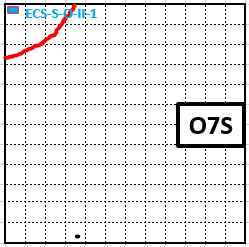
Correlation between Deflection Responses and Local Distresses
The figures below illustrate the change in the maximum deflection response of ECS-S-O-II-1 and the occurrence of the corner breaks that took place within the same time frame. Past wander 100, an increase in the rate of change in maximum deflection was observed. Between wander 255 and 265, the maximum deflection began to level off.
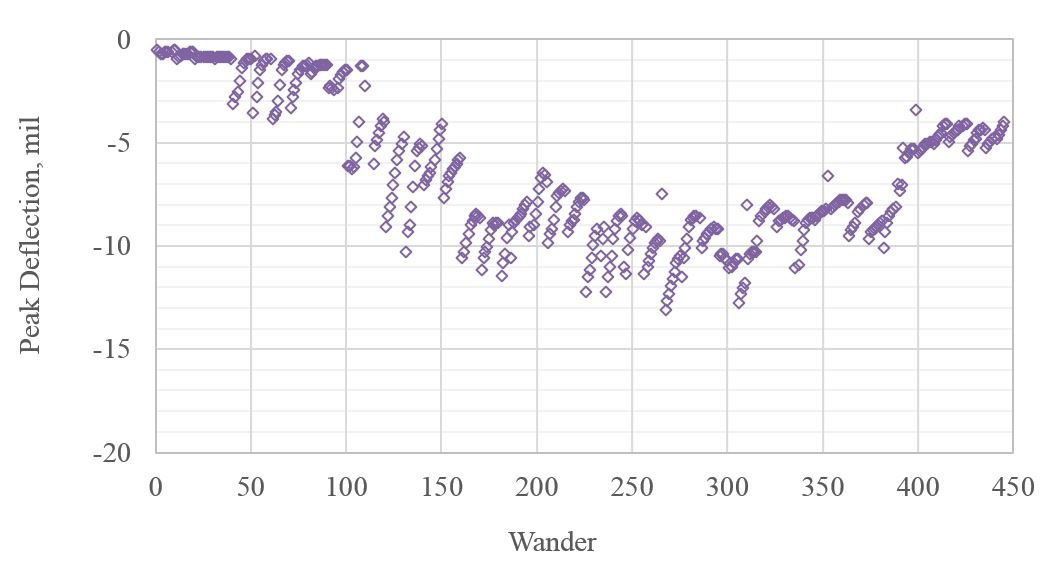
CC8 Phase 2 Overlay Change in Maximum Response with Traffic (Click to Zoom)
CC8 Phase 2 Overlay Corner Break (Click to Zoom)
Deflection Basin
On the north test item notable changes in the deflection basin over the course of trafficking were observed in slabs O1N through O5N. In these slabs, deflections gradually increased with respect to the baseline. This indicates that the overall strength of the pavement system deteriorated with traffic. On slabs O1N and O3N, an increase in deflections was noticed at the geophone located 72 inches from the center of the loading plate. This suggests that some of the damage accumulated in deeper layers during the traffic test. In general, no significant variations in the deflection basin were observed for slabs O6N through O10N. However, some changes were recorded by the geophones at 48 and 60 inches in slabs O7N and O9N. This indicates the possibility of isolated damage in supporting layers. As expected, the outer slabs O6N through O10N did not exhibit significant deterioration.
On the south test item no significant variation in deflection basins were observed on the outer slabs (i.e., O6S through O10S) compared to those in the inner lane (i.e., O1S through O5S) which received most of the traffic. Deflection on inner slabs increased over the course of traffic. Slab O5S presented the least variation in the deflection basin over time, and showed the least amount of distresses as reflected by the crack density parameter. Conversely, slab O1S showed the most significant changes in the deflection basin starting on 11/30/2017. Such changes reflected the severe deterioration underwent by slab O1S within the same period: occurrence of a diagonal crack across the slab center and subsequent shattering after 11/30/2017.
Failure Mechanism
Distress Pattern
CC8 Phase 2 Overlay Major Distresses Driving Sharp Drops in Overlay (Click to Zoom)
Corner Deterioration
-
Corner-to-Center Deflection Ratio
The corner-to-center deflection ratio corresponding to the heaviest load (i.e., 36,000 pounds) was calculated for selected locations of the slabs on both the north and south test item. The variation of the corner-to-center deflection ratio over time was analyzed for the north and south test items, respectively. During the baseline HWD testing, the corner-to-center deflection ratio ranged from 1.1 to 1.7. After the traffic test started on 10/10/2017, the corner-to-center deflection ratio showed an increase.
The results of this analysis demonstrated that the loss of support from underlaying layers in the south test item was more significant than the north side. This is consistent with the deterioration observed in the south test item where corner breaks dominated the distress pattern. Moreover, this reinforces the speculation that the underlaying support conditions in the south test item may have induced the unexpected high rate of deterioration and premature failure relative to the north test item.
·
Based on the observation of the corner deflection on the north test item, only corner 8NW exhibited a slight potential for void existence. However, no corner break was reported at this location. The presence of voids underneath all other corners evaluated in the north test item can be disregarded. Moreover, only one corner break was observed in the north test item which is consistent with the absence of evidence supporting the existence of voids.
The presence of voids in the south test item is consistent with corner breaks dominating the distress pattern, and with the premature deterioration and failure relative to the north side. This also supports the supposition that there were deficient support conditions for some of the slabs in the south test item.
Interior Slab Deterioration
Interior slab deterioration was investigated using three parameters:
- ISM that represents the overall stiffness of an entire pavement system/cross-section
- Backcalculated layer moduli (E-values) that represent stiffness of individual layers
- Dissipated energy from material damage.
To understand the correlation between the overlay deterioration and overall pavement stiffness, average ISM values are plotted against SCI, in the figure below, for both the north and south test item. Below the threshold SCI value (60), the ISM values on the North side shifted up before continuing the decreasing trend. The increased stiffness of the asphalt interlayer at low temperatures possibly contributed to an increase of the overall pavement stiffness which leads to a drop in the measured deflections.
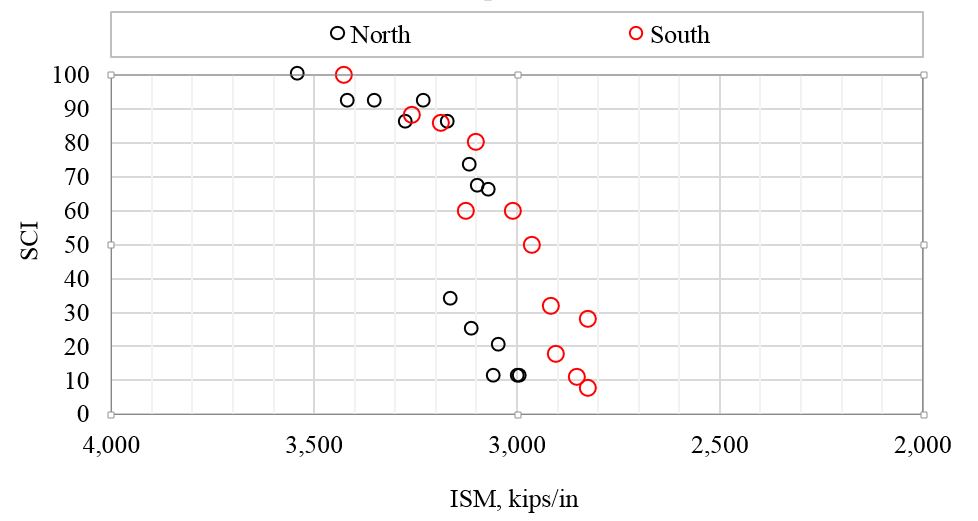
CC8 Phase 2 Overlay Change in ISM with SCI (Click to Zoom)
-
Backcalculated Layer Moduli
Layer moduli were backcalculated using the HWD deflection basin collected from the center of the slabs. In general, the layer moduli degraded. The rate of modulus degradation was high in the PCC overlay and underlay compared to that in unbound materials. The layer moduli on the north test item were slightly higher than those on the south test item. The unbound layers (i.e., subbase and subgrade) also degraded with slight difference in trends. The figure below shows the change in average PCC overlay modulus with change in SCI for both north and south test item. For both test items, the modulus degraded with decreasing SCI.
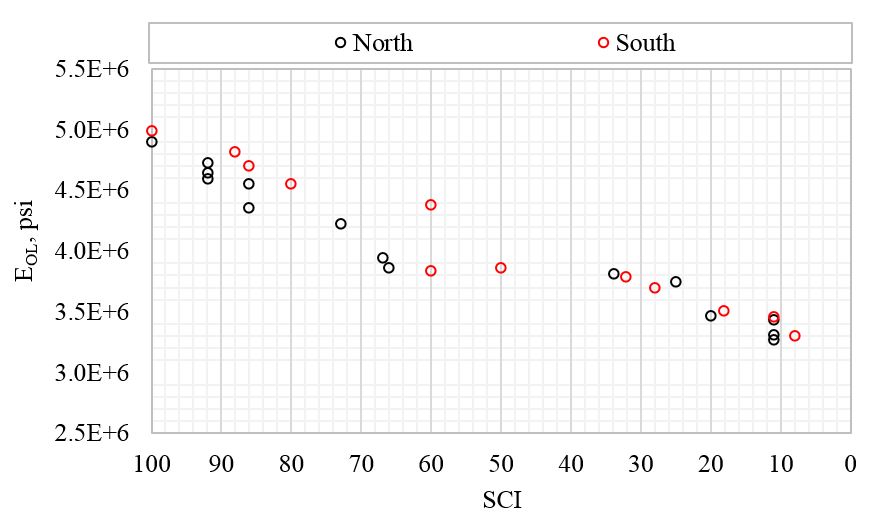
CC8 Phase 2 Overlay Change in Backcalculated Modulus with Change in SCI (Click to Zoom)
·
Joint Deterioration
HWD tests were conducted along 8 transverse joints (4 on the north and 4 on the south) in the overlay test area to determine the Load Transfer Efficiency (LTE) based on the deflection measurement. Overall, the joint performance in terms of LTE deteriorated over the course of trafficking due to the gradual accumulation of distress on pavement surface. In addition, considering both the north and south test item, an LTE ranging between 55% and 65% was attained when the SCI dropped to about 10.
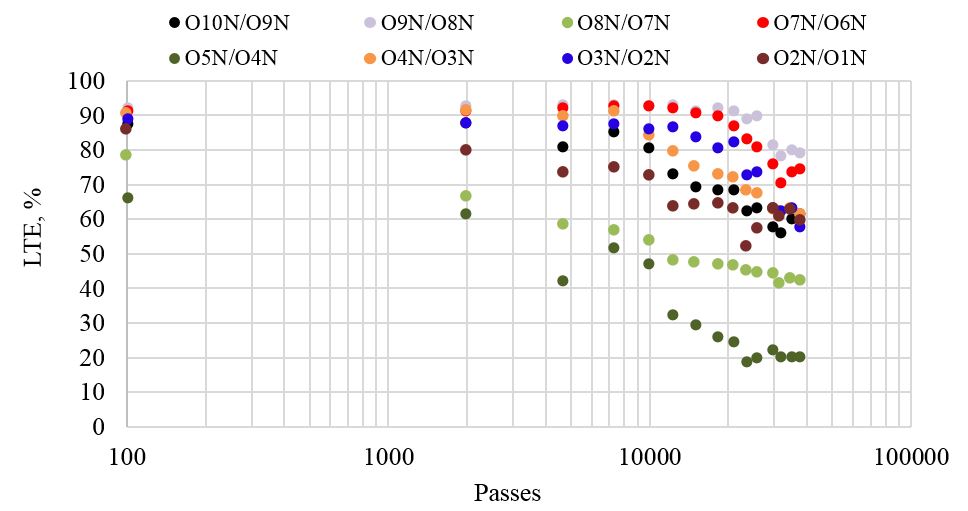
CC8 Phase 2 Change in LTE with Traffic on the North (Click to Zoom)
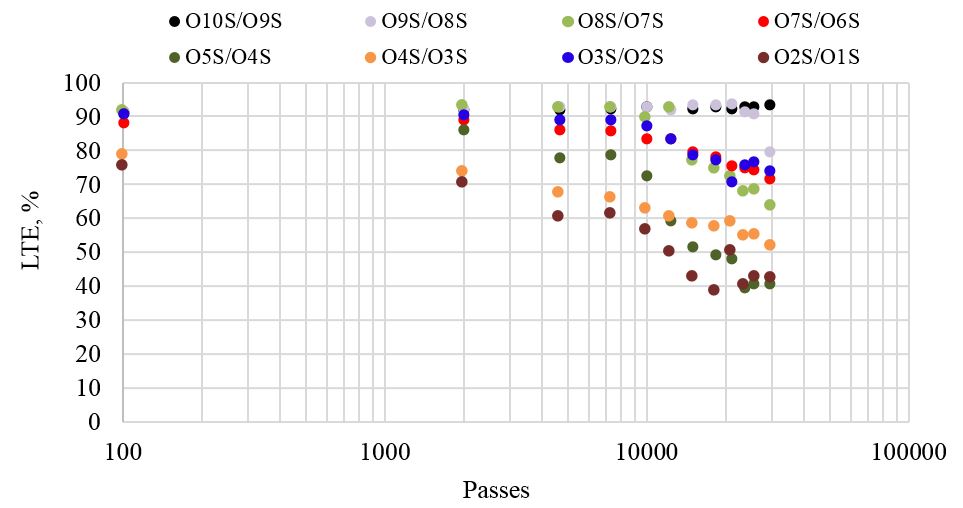
CC8 Phase 2 Change in LTE with Traffic on the South (Click to Zoom)
Joint Stiffness
Joint stiffness was calculated using the deflection values from HWD testing. The joint stiffness was calculated using a series of equations and the correlations between LTE and joint stiffness were plotted.
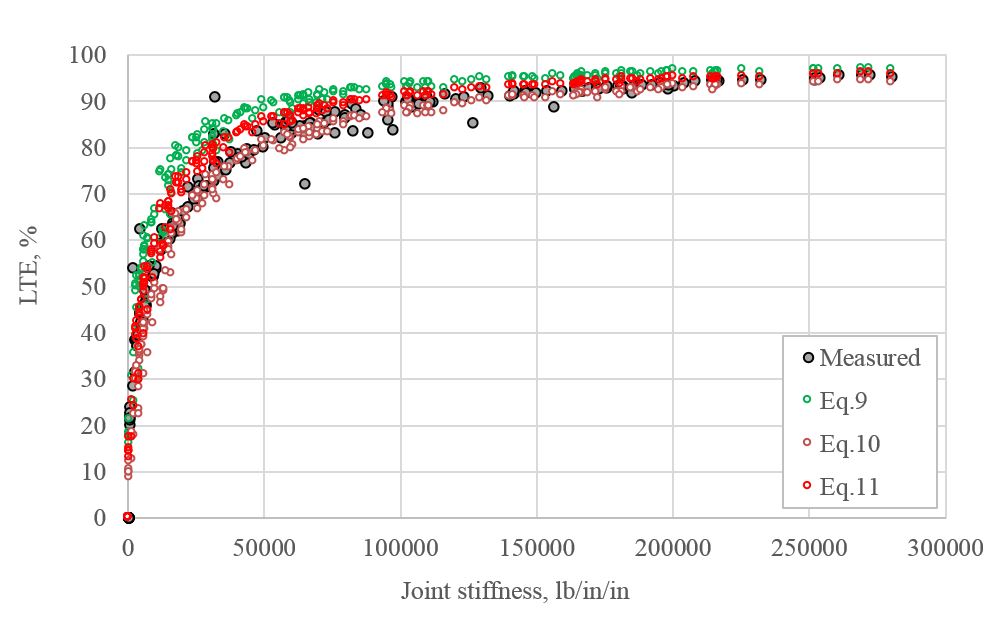
CC8 Phase 2 Overlay Joint Stiffness as Function of LTE (Click to Zoom)
Conclusions
Based on the results of the CC8 Phase 2 Overlay Test, the key finds were:
- Corner breaks and longitudinal cracks dominated the distress pattern. Premature localized damage in the south test item possibly triggered reflective cracking from CC8 Phase 1 longitudinal joints. Random, tight, isolated interior surface cracks were also observed in the north test item during the early stage of traffic with delayed initiation of reflective cracking, relative to the south side.
- Underlay damage with higher incidence on the south side, during the overlay traffic test is suspected. The premature deterioration and failure in the south test item may have reflected the underlay deterioration pattern.
- Similar to the approach followed in CC4, crack density was evaluated as an indicator of overlay deterioration. Good agreement was found between crack density and SCI.
- The evaluation of the neutral axis position (NAP) using dynamic instrumentation data evidenced the effect of the HMA interlayer on the mechanical response of the concrete overlay.
- An evaluation of slab corner deterioration was conducted. In general, both high corner-to-center deflection ratios and the detection of voids in the south test item was found to be consistent with corner breaks dominating the distress pattern, and with the premature deterioration and failure relative to the north side. This also supports the diagnosis of a deficiency in the underlaying support conditions in the south test item.
- An evaluation of the slab interior deterioration revealed that backcalculated moduli and ISM captured the degradation of the overall stiffness of the pavement. Dissipated energy from the load-deflection hysteresis loop based on HWD test data was introduced in the analysis as an indicator of structural damage. Increasing dissipated energy was observed with increasing crack density, and decreasing overlay modulus and SCI.
- The joint deterioration was evaluated in terms of LTE. A good correlation was observed between LTE and SCI. Considering both the north and south test item, an LTE ranging between 55% and 65% was attained when the SCI dropped to about 10.
- Discrepancies between the FAARFIELD failure prediction and the actual overlay deterioration during the traffic test were observed. The predicted number of passes to failure were 31 and 103 for the north and south test item, respectively. The overlay actually required 13,530 and 5,940 passes to achieve a SCI value around 80 in the north and south test item, respectively.
- CC8 Phase 2 Overlay test data verified the linear deterioration trend reported in CC4. Compared to Rolling’s performance model, rather than showing a slowing deterioration rate, the CC8 linear relationship shows a relatively constant rate of deterioration. Furthermore, when comparing the CC4 to CC8 linear relationships capturing the overlay deterioration, both show similar slopes.
- The deterioration rate and distress pattern observed in CC8 Phase 2 Overlay test along with the discrepancy between predicted and observed pavement life suggests conservatism of the FAARFIELD failure model.
- HWD test data was used to evaluate joint stiffness. Good agreement was found between measured and predicted transverse joint stiffness.
Additional Resources
To be directed to the CC8 Phase 2 Overlay Test Database, click here.
To be directed to the CC8 Phase 2 Overlay Comprehensive Report, click here.
Return to Construction Cycle 8 Overview