Reflective Cracking Phase I
Phase I Test Summary
Full-scale tests took place in May 2012 and ended in June 2012. The first two stages were conducted with a maximum joint opening of 0.015-in. and two displacement rates, one cycle per 600 and 300sec, respectively. In Stage 3, a ramp loading with a displacement rate of 0.10 mil/sec was applied to propagate the crack through the top 0.5-in. overlay.
|
Date
|
Stage
|
Type of Loading
|
Maximum Horizontal Displacement, mil
|
Displacement Rate, mil/sec
|
Cycles
|
|
05/22-06/01
|
1
|
Cyclic
|
15
|
0.05
|
1324
|
|
06/02-06/04
|
2
|
Cyclic
|
15
|
0.10
|
765
|
|
06/04
|
3
|
Ramp
|
118
|
0.10
|
NA
|
Objectives
The objective of Phase I Test was to examine the appropriateness of substituting temperature load with mechanical load in full-scale tests. In addition, it was expected to identify critical test parameters and capture crack initiation and propagation through various instrumentation techniques.
Pavement Design
It is a common practice to construct AC overlay in 1.5-2.5 in lifts in airfields. From full-scale test point of view, a 5-in thick AC overlay can be easily constructed with two 2.5-in lifts and avoid possible secondary cracks. To focus on bottom-up reflection cracks, a pavement structure consisting of 5 in AC, 12 in PCC, and 250 in subgrade was selected for this study.
Construction
Phase I was paved on December 15, 2011. Standard FAA materials were used, P-401 (PG 64-22) for AC and P-501 for PCC. To reduce the friction between the PCC slabs and foundation, a 0.25-in.-thick Teflon® sheet was sandwiched between two layers. The PCC layer consisted of two 12-in thick, 15- by 15-ft heavy broom finished slabs; one was stationary and the other was movable. A thin tack coat of straight PG 64-22 asphalt was applied before HMA placement. It was believed the combination of straight asphalt and heavy broom finish would ensure minimum interface debonding. The HMA layer was constructed with two 2.5-in. lifts.
The construction daily notes can be found here.
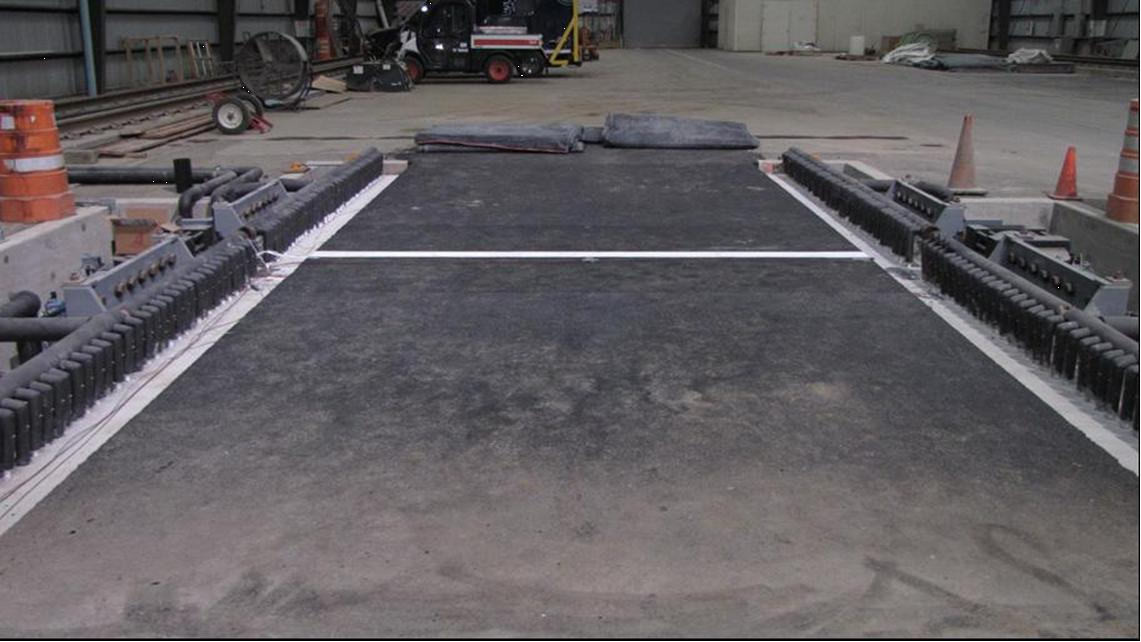
Figure 1. Phase I Test Pavement Construction after Completion (Click to Zoom)
Instrumentation
Monitoring crack-progression is challenging. Specifically, the fracture process zone ahead of the crack tip has complex phenomena where aggregates can slide along and bridge the crack face. Based upon previous instrumentation experience at NAPTF, two types of sensors were used in this study to acquire information of crack progression, surface strain gage (SG) and crack detector (CD). The CD is simply a single strand of copper wire, and any erratic change in the output signal (i.e., voltage) indicates a discontinuity. Grinding of the pavement surface accomplished both the creation of a slight indentation as well as a smooth area for the installation of the sensor. The sensors were later placed on the prepared surface with the manufacturer’s recommended adhesive. Next, a thin layer of coating was applied on top of each sensor for water- and corrosion-proof purposes. Extensometers (E) were installed on the pavement surface to measure the opening of existing cracks. In addition, thermocouples (T) were installed at various depths in the overlay. On the pavement surface, SGs and CDs were placed on the “best guess” path of the existing crack to monitor horizontal propagation. On the side of pavement, all SGs and CDs were put directly above the PCC joint where the bottom-up crack would be most likely to occur.
RC Phase I Drawing
Testing Protocol
Temperature variations were approximated by a haversine waveform describing the relationship between the joint opening and cycle time:
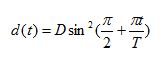
where t is the time of interest, D is the amplitude of joint opening, and T is the cycle time. The maximum joint opening (D) was set at 15 mils. In Stage 1 testing, each haversine loading cycle began with a loading time of 300sec, once the actuators reached the maximum horizontal displacement (joint opening), a 300-sec unloading was executed. In Stage 2 testing, the cycle time was changed from 600sec to 300sec and the maximum horizontal displacement remained the same.
Test Results
Preliminary trial tests unintentionally damaged the overlay and resulted in only a 15–in. intact portion left on the north side. The mishaps had resulted in a much more complicated (unknown) stress state in the test pavement. Therefore, the analysis conducted using instrumentation may not represent what would have happened if the pavement was undamaged.
The testing daily notes can be found here.
Crack Initiation
Strain gage responses were used as the primary tool to determine crack initiation. In addition, a visual examination of the test pavement was conducted multiple times a day to identify cracks off the “best guess” crack path and trace the extension of existing cracks. Based upon the gage location (Figure 1), the necessary number of cycles to form an invisible damaged area/zone varies:
- If the gage is on the crack path, such as SG-2, a continuous raise in tension will be recorded as the gage bridges the crack and eventually goes out of range.
- If the gage is off but close to the crack path (within 0.5 in.), such as SG-1 and SG-3, a significant drop in tension will be recorded as the strain energy is released by the crack formation.
- If the gage is away from the crack path (more than 0.5 in.), such as SG-4, a constant low-magnitude tensile strain will be recorded.
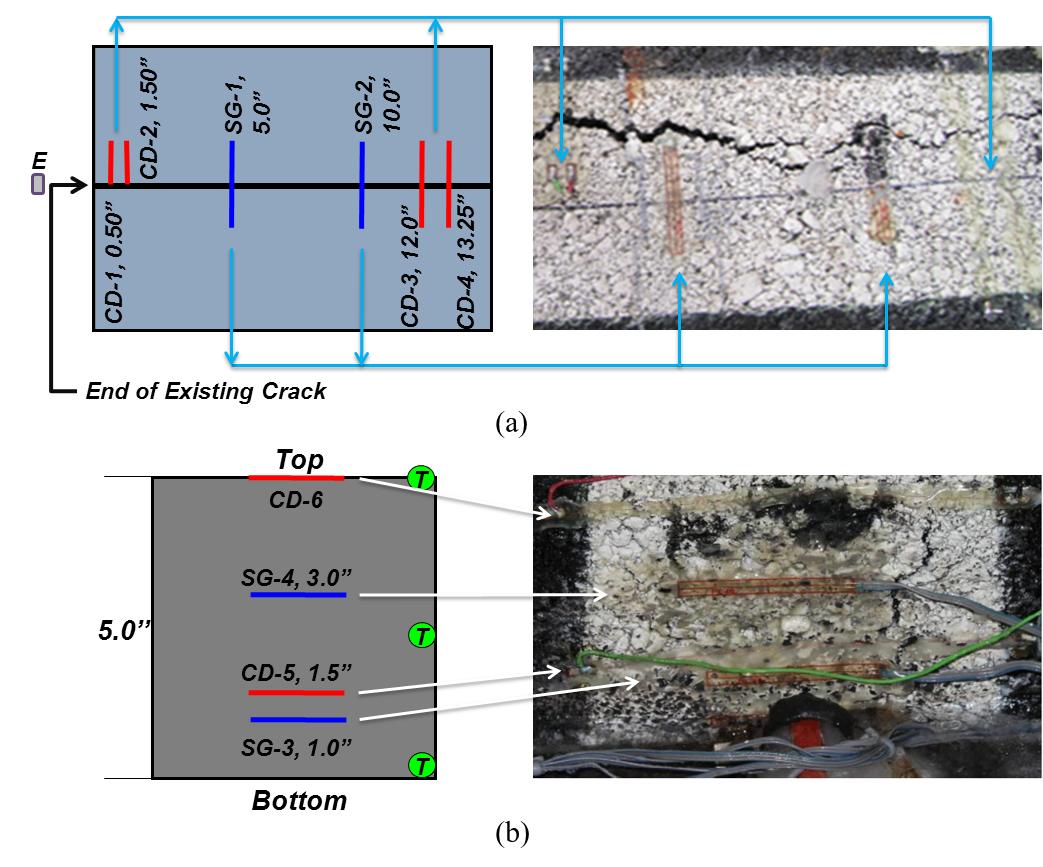
Figure 2. Crack Initiation: Surface (a) and Side (b)
(Click to Zoom)
Crack Propagation
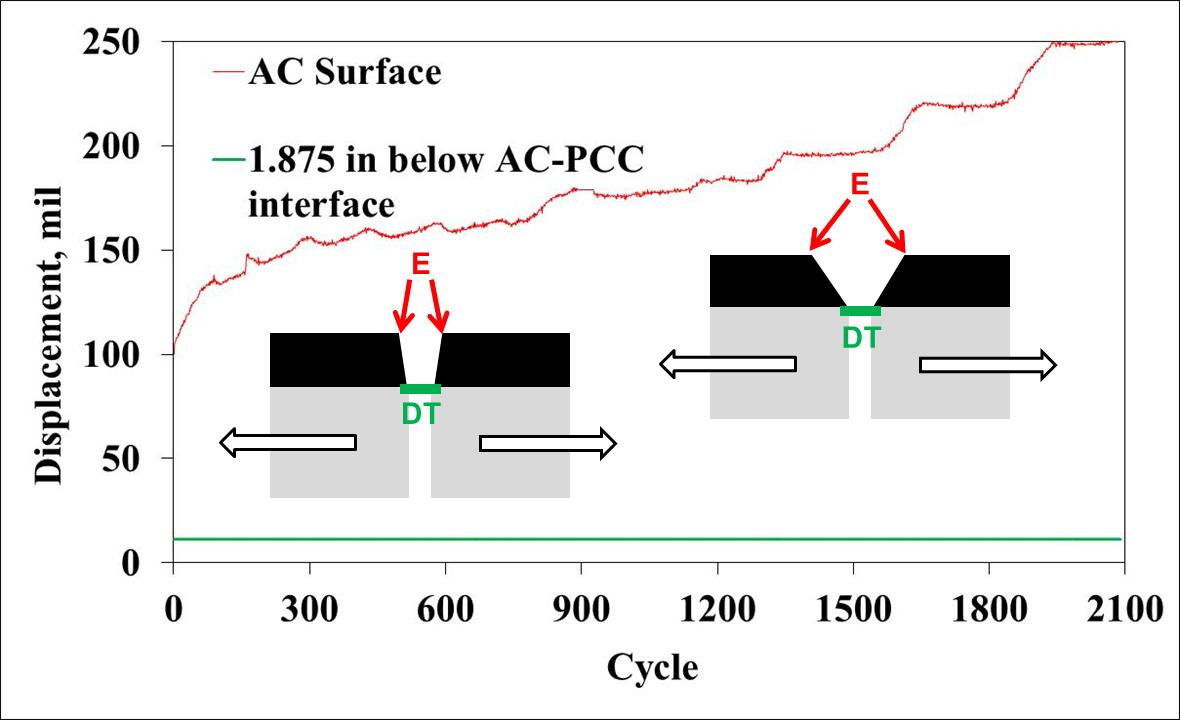
In Figure 2, the low pair of data points was from SG-3, the middle ones were from CD-5, and the upper ones were visual observations at the end of Stage 2. Although the higher loading rate did not result in higher strain level, it is apparent that the loading rate had a substantial influence on the crack propagation, especially when the crack reached the upper portion of the overlay. The crack length progressed slowly at the beginning, and its propagation rate became faster and faster with crack length growth. This observation indicates that the crack propagation stage undergoes a transition from quiescent to aggressive. If a temperature-induced loading condition is fixed, there could be critical thickness of the HMA overlay, below which it may take thousands of cooling cycles to propagate the crack to the surface.
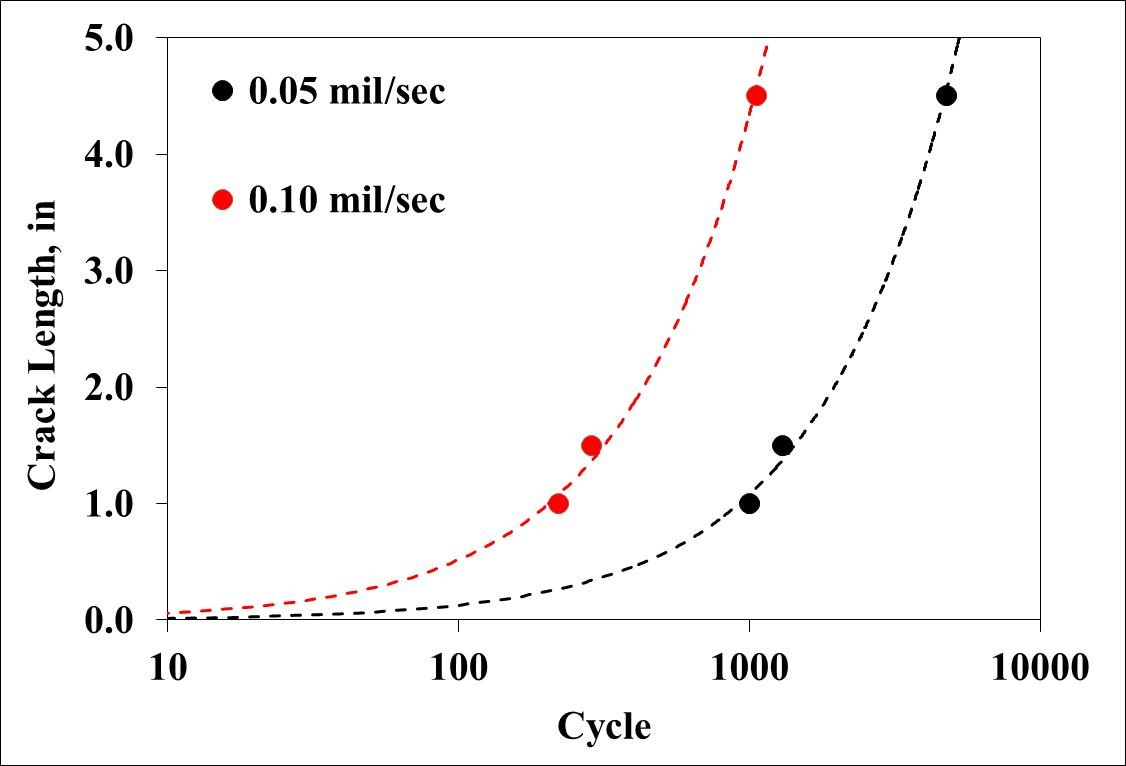
Figure 3. Crack Propagation in Stage 1 and 2 (Click to Zoom)
After 2089 cycles of cyclic loading, the bottom-up crack still did not penetrate the top 0.5-in. overlay. A ramp loading with a displacement rate of 0.10 mil/sec was then applied. Stage 3 was aborted once the bottom-up crack became visible on the surface. A complete history of actuator position and force is given in Figure 3. During the first 1.5 minutes, a spiky raise of tensile actuator force was recorded. Two minutes later, the force started to flatten, which suggests the complete crack propagation and separation of two overlay pieces. Interestingly, the initial closing (negative) force generated by the actuator revealed that the stress state at the bottom of overlay was in compression.
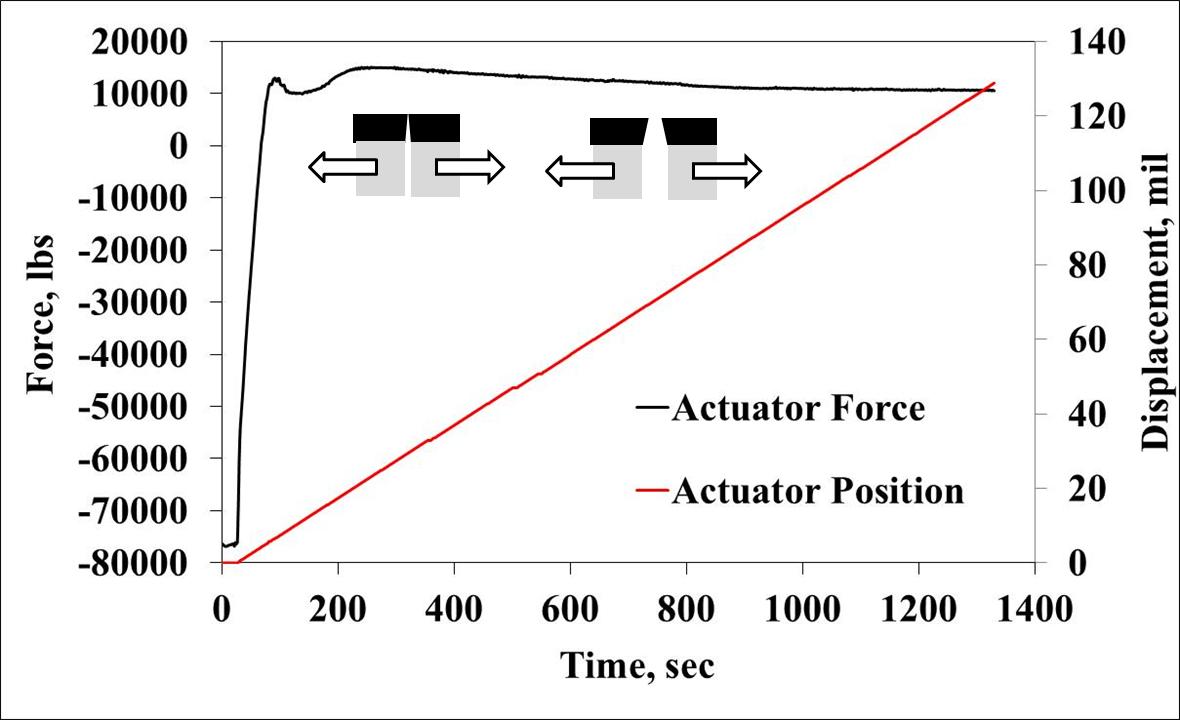
Figure 4. Crack Propagation in Stage 3 (Click to Zoom)
Overlay Relaxation
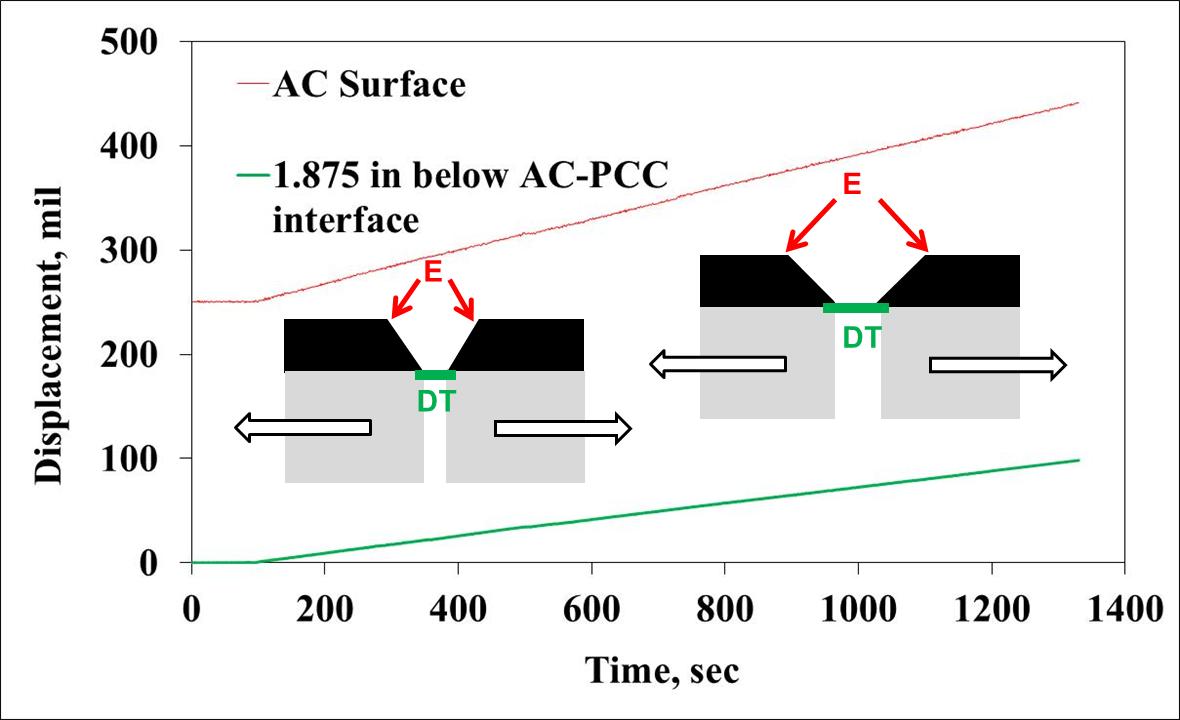
During the construction of concrete slabs, several displacement transducers (DT) were installed between two slabs and at 1.875 in. below the surface. The green line in Figure 4a represents the horizontal displacement from one DT at 65 in. from the slab edge. This horizontal displace was constantly 11.3 mil throughout the cyclic loading (Stage 1 and 2) because the joint opening was fixed at 15 mil. Directly above the DT, an extensometer (E) captured a nonstop widening of the crack opening on the surface. Readings from the same two gages during Stage 3 are presented in Figure 4b. By releasing the horizontal displacement between two slabs, more equal crack opening rates at top and bottom were achieved before the overlay broke fully into two pieces (the first 3-4 minutes). It therefore can be concluded that the compressive force had a counter effect on the crack propagation during cyclic loading tests, in which sufficient time was not allowed for HMA to relax.
(a) Cyclic Loading (Click to Zoom)
(b) Ramp Loading (Click to Zoom)
Figure 5. Crack Opening
Conclusions
To assist airport engineers and others concerned with the design of AC overlay on rigid airport pavement, the FAA initiated a reflective cracking research project. The early stage of the research was focused on the mechanism of temperature induced reflective cracks due to existing cracks or joints in the underlying pavement. To mechanically simulate horizontal joint movements purely due to temperature changes, a temperature effect simulation system (TESS) was designed, built, and installed at the NAPTF. A test pavement was also constructed to support full-scale tests.
Phase I test demonstrated that the TESS could not only generate accurate horizontal displacements at the slab joint but also effectively control the pavement temperature. Since neither the interface slippage nor secondary crack occurred, it can be concluded that a combination of heavy broom-finished and straight asphalt tack provided a satisfactory bonding condition at the AC-PCC interface. Both crack initiation and propagation were successfully captured through instrumentation devices. However, since the testing protocol did not include rest period during cyclic loading tests, a significant joint closing force was generated and accumulated at the overlay bottom and consequently interfered with further crack development.
References
- Yin, H. and Barbagallo, D. (2013) 'Development of Full-scale Reflective Cracking Test at FAA NAPTF,' Transportation Research Record No.2368.
- Yin, H. (2013) 'Finite Element Modeling and Analysis of Full-scale Reflective Cracking Test,' International Journal of Roads and Airports, Volume 3.
- Yin, H. (2017) Reflective Cracking Phase I Test Report.
Return to Reflective Cracking Overview