Reflective Cracking Phase V
Phase V Test Summary
Full-scale tests started on March 3, 2017. After 1919 cycles, the overlay was completely separated and the test concluded on March 20, 2017.
Objective
The primary objective of Phase V test was to compare the performance of different overlay thicknesses and answer the question “Is increasing thickness an effective way to extend the overlay fatigue life?” Phase V test was also expected to further enrich reflective cracking database, particularly the crack propagation rates under controlled loading conditions to mimic the temperature cycles occurring in nature.
Overlay Design
Construction
Phase V was paved on January 12, 2017. As shown in Figure 1, test overlay was paved in two lanes (i.e., north and south) using the same materials, the standard FAA P-401 PG 64-22 HMA, but different overlay thicknesses (i.e., 3-in. vs. 6-in.). After placing of each lift, the HMA materials were thoroughly and uniformly compacted by a power rollers without vibration due to the sensors underneath. Then the density atop each lift were measured using Nuclear Densometer. Nuclear density rolling pattern was established to get the density results of the two focus points on the mat.
The construction daily notes can be found here.
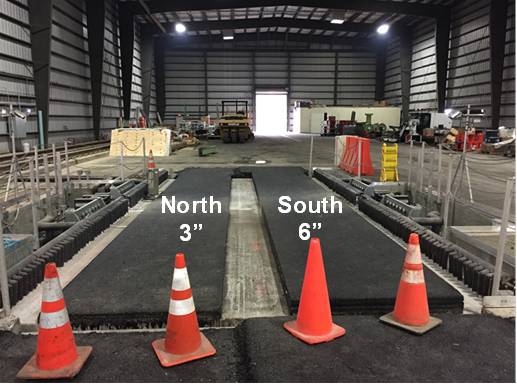
Figure 1. Phase V Test Pavement (Click to Zoom)
Instrumentation
During the overlay paving, H-type asphalt strain gages (EG) were placed at the bottom of each lift (1.5 in.) of the overlay. After the overlay paving, surface strain gages (SG) were installed at various locations on the surface. Thermocouple trees were installed in each overlay section to acquire temperature gradients. Each tree consisted of multiple thermocouples (T) to measure temperature at the same depth as strain gages. Note that all strain gages are directly above and perpendicular to the concrete joint where the first reflection crack would most likely occur.
RC Phase V Drawing
Testing Protocol
Temperature variations were approximated by a haversine waveform describing the relationship between the joint opening and cycle time:
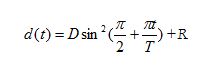
oF) at the overlay bottom in the field. Each haversine loading cycle began with a loading time of 75 sec, once the actuators reached the maximum horizontal displacement (joint opening), a 75-sec unloading was executed and then followed by a rest period of 600 sec to allow the overlay to relax.
Test Results
The testing daily notes can be found here.
Observations
Upon the completion of testing, cracks on the edges were full-depth through the overlay. On the thin section (Figure 2a), the crack initiated at the overlay bottom. At first, the crack propagated upward, indicating fracture Mode I dominance. Once this vertical crack reached the boundary of two 1.5-in lifts, it started to deviate at an angle toward the surface. Meanwhile, a second crack propagated from the top of the overlay, headed to the bottom, but was arrested at the lift interface. On the thick section (Figure 2b), despite of some wiggling, a bottom-up crack formed at the overlay bottom and progressed on its upward track. Figures 3 and 4 show that the resulting transverse crack was directly atop the underlying PCC joint inn the horizontal plane. The crack not only propagated in a vertical direction, but also tended to develop across the overlay (along the joint) as well.
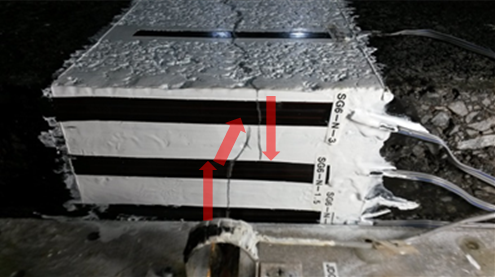
(a) North
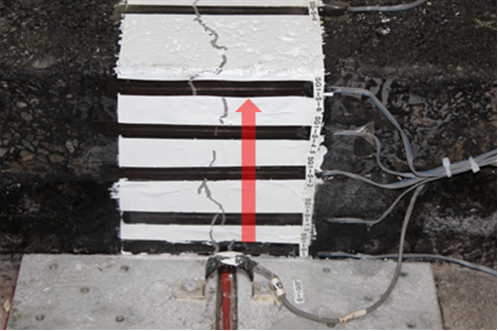
(b) South
Figure 2. Cracks on the Outer Edge (Click to Zoom)
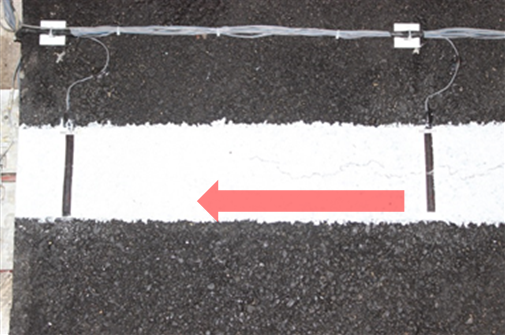
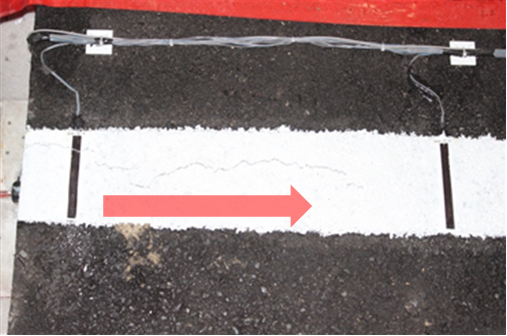
(a) During Test
(b) After Test
Figure 3. Cracks on the Surface, North Section (Click to Zoom)
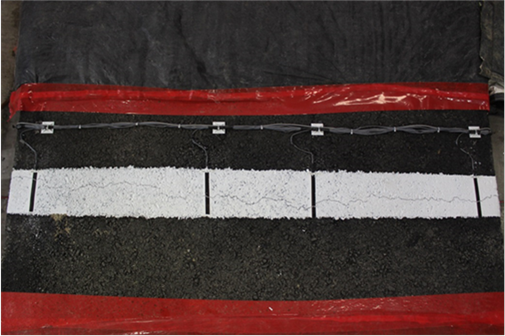
(a) During Test
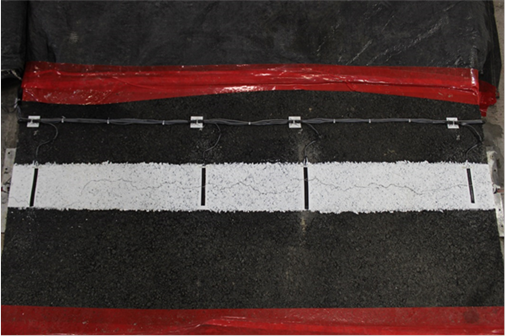
(b) After Test
Figure 4. Cracks on the Surface, South Section (Click to Zoom)
Failure Mechanism
Figure 5 is a contour plot generated from the cycles. It demonstrates that the first crack presence on both north and south section was at the bottom of the outer edges where the maximum tensile stresses were located. A close examination of Figure 5 reveals that two bottom-up reflection cracks exhibited a distinct progression and therefore resulted in an opposite location of the last fracture occurrence on the inner edges. This observation agrees with previous full-scale tests that a bottom-up crack can advance in other orientations in addition to the through-thickness direction. At shorter crack lengths, propagation was driven purely by tension and the crack grew straight up into the overlay. At intermediate depths, the bottom-up crack re-orientated because the stress states within the HMA layer changed with depth.
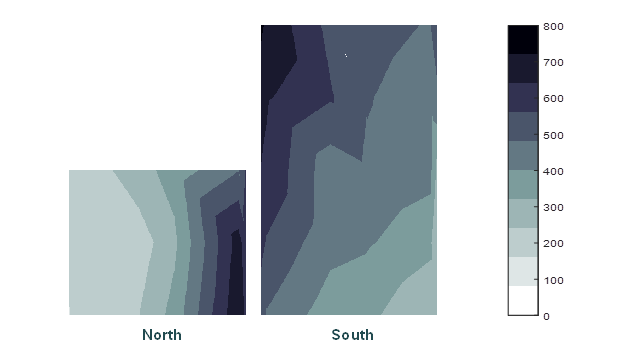
Figure 5. Crack Propagation (Click to Zoom)
The crack propagation rate (CPR) controls the crack orientation. Figure 6a plots the Vertical Crack Propagation (CPRv) at 0, 24, 36, and 60 in from the origin of the reflection crack (outer edge). The CPRv was fairly uniform across the width of the overlay except for an extreme value at the outer edge of the thin section. This explains why the thin overlay cracked 100 cycles earlier than the thick overlay. Figure 6b plots the Horizontal Crack Propagation (CPRh) at varies depths parallel to the PCC joint. On the horizontal plane, the thin overlay possessed a higher CPRh at the surface and a reverse for the thick overlay. This explains the downward path of the secondary crack on the thin overlay. Because the CPRh at all depths was higher for the thick overlay, it only preserved 35 more loading cycles than the thin overlay (740 vs. 705). It can be concluded that the major contribution to the overlay failure was the horizontal crack evolution due to its 10 times higher CPR.
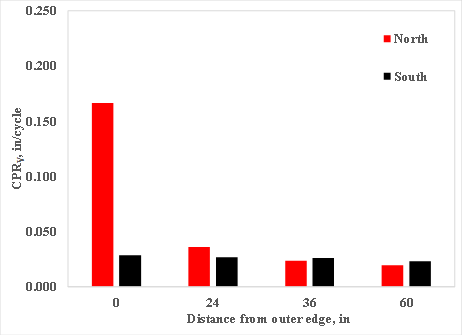
(a) Vertical
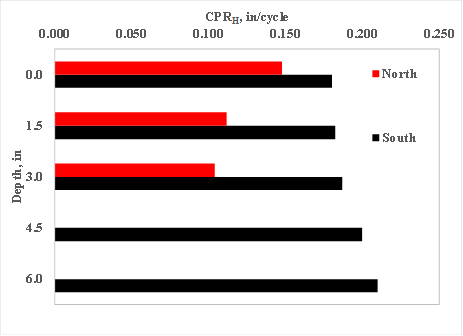
(b) Horizontal
Figure 6. Crack Propagation Rate in Different Directions (Click to Zoom)
Effect of Overlay Thickness
The overlay thickness significantly affects the magnitude of the tensile stresses at the bottom of overlay, the failure strains in the overlay, and therefore the evolution of reflection cracks. Because the north and south sections had a different overlay thickness (3-in. vs. 6-in.), the relationship between normalized crack length and number of cycles is shown in Figure 7. It is clear that both thin and thick sections exhibited a more or less linear crack progression. On the thin section, the crack evolution was much more abrupt and took 18 cycles to propagate the bottom-up crack to the surface. This would imply that a crack could penetrate completely through the overlay in as little as 18 cooling cycles due to the confounding effect of the overlay thickness and brittleness of HMA at low temperatures. It might be tempting to conclude from Figure 7 that the effect of overlay thickness on the crack propagation lessens for thinner overlays, but it should be remembered that this represents only the crack evolution in the vertical direction. As discovered in the analysis of crack propagation rate (CPR), the horizontal crack evolution was much swifter than the vertical direction, particularly for the thick overlay. It does not mean that the horizontal crack evolution did not occur in the thinner overlays, only that, if it did, it was probably occurring simultaneously with bottom-up cracking. In other words, thicker overlays appeared to significantly delay the occurrence of bottom-up reflective cracking, while not significantly reducing the incidence of the crack progression along the PCC joint.
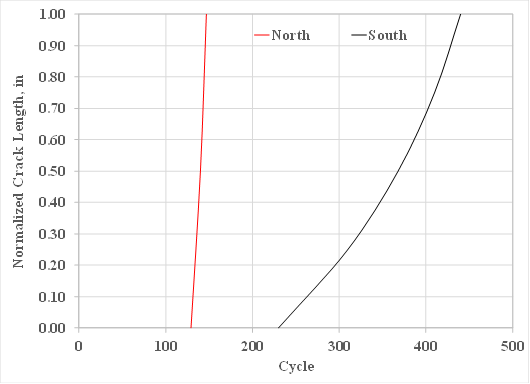
Figure 7. Crack Evolution (Click to Zoom)
Conclusions
In Phase V Test the effectiveness of overlay thickness to retard thermally-induced reflection cracks was evaluated. Two overlay sections consisted of the same materials, the standard FAA P-401 PG 64-22 HMA, but different overlay thicknesses (i.e., 3-in. vs. 6-in.). Side-by-side comparisons of overlay performance led to the following conclusions:
- Increasing overlay thickness significantly delays the occurrence of bottom-up reflection cracks, however not reduces the incidence of horizontal crack progression.
- Once a bottom-up crack initiates, it can penetrate a thin overlay in a very short period of time.
The above may only be applicable to lightly loaded airport pavement structures, such as general aviation airports and regions of airport runways, taxiway, and aprons which receive little or no aircraft loading.
References
- Yin, H. (2017) Reflective Cracking Phase V Test Report
Return to Reflective Cracking Overview