CC8 Phase 1 Overload Traffic Test
Introduction
The National Airport Pavement Test Vehicle (NAPTV) in the NAPTF is a rail-based test vehicle capable of simulating an aircraft weighing up to 1.3 million pounds. The NAPTV consists of two carriages, a north carriage and a south carriage, each that can accommodate up to five load modules. Each load module can support two wheels, allowing for configurations of up to 20 wheels. The NAPTV can apply loads of up to 75,000 pounds per wheel and simulates aircraft wander by varying the lateral position of the carriages.
Gear Configuration
For the Phase 1 Overload Test a two gear configurations was used, a two-wheel (D) and four-wheel (2D). The dimensions of the load configuration are illustrated in the figure below. The dual spacing was 54 inches and the tandem spacing was 57 inches.
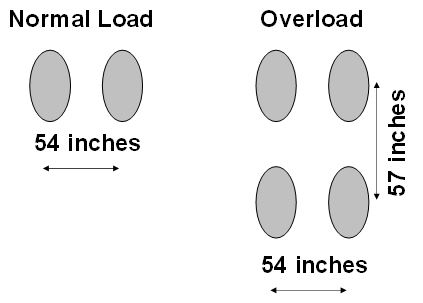
CC8 Phase 1 Overload Gear Configuration (Click to Zoom)
Pre Trafficking
Prior to full scale trafficking on the Phase 1 Overload section a seating load was performed using a two wheel (dual) gear at 10,000 lbs. per wheel. During the seating load the slab was monitored for vertical movement using vertical deflection sensors.
Following the seating load, a slow-roll response test was conducted and baseline dynamic sensor readings were recorded. The slow-roll response was conducted using a two wheel (dual) gear at 10,000 lbs. per wheel and a NAPTV speed of 0.5 miles per hour.
Full Scale Trafficking
Full scale trafficking of the Phase 1 Overload Test was conducted in a number of stages. The dates, vehicle configurations, wheel loads, and loading passing for each stage of trafficking are summarized in the table below. Trafficking was performed at 2.5 mph with a nominal tire pressure for all load levels was 220 psi.
|
Dates
(all 2016)
|
Traffic Type
|
Wheel Load, lbs.
|
Wanders (North)
|
Wanders (South)
|
Cumulative Passes
|
|
22 Feb
|
Normal I
|
20,000
|
1
|
1
|
66
|
|
22 Feb
|
Overload I
|
21,500
|
0
|
1
|
132
|
|
Overload I
|
22,500
|
0
|
1
|
198
|
|
Overload I
|
23,000
|
0
|
1
|
264
|
|
Overload I
|
24,000
|
0
|
1
|
330
|
|
Overload I
|
25,000
|
0
|
1
|
396
|
|
23-24 Feb
|
Normal I
|
20,000
|
19
|
19
|
1650
|
|
25 Feb
|
Normal II
|
28,000
|
1
|
1
|
1716
|
|
25-26 Feb
|
Overload II
|
28,500
|
0
|
1
|
1782
|
|
Overload II
|
29,500
|
0
|
1
|
1848
|
|
Overload II
|
30,500
|
0
|
1
|
1914
|
|
Overload II
|
31,500
|
0
|
1
|
1980
|
|
Overload II
|
32,500
|
0
|
1
|
2046
|
|
26 Feb -
2 Mar
|
Normal II
|
28,000
|
36
|
36
|
4422
|
|
9-15 Mar
|
Normal II
|
28,000
|
33
|
0
|
6600
|
|
14-19 Sep
|
Normal II
|
28,000
|
28
|
0
|
8448
|
Wander Pattern
The Phase 1 Overload Test wander pattern and positions is illustrated in the figure below. The wander pattern used for the Phase 1 Overload Test consisted of 66 vehicle passes, with each passage of the NAPTV to the east being counted as a pass, and the return to the west counting as a second pass.
The 66 passes were arranged in 9 wander positions. Offsets from the centerline are provided in feet. The offset dimensions refer to the distance to the center of the load module, which is midway between the tires. The figure below should be used in reference to the track numbers given in the database.
Carriage Positions for each Track
|
Track No.
|
Carriage Centerline Location, ft.
|
|
North
|
South
|
|
-4
|
-15.662
|
8.838
|
|
-3
|
-14.809
|
9.691
|
|
-2
|
-13.956
|
10.544
|
|
-1
|
-13.103
|
11.397
|
|
0
|
-12.250
|
12.250
|
|
1
|
-11.397
|
13.103
|
|
2
|
-10.544
|
13.956
|
|
3
|
-9.691
|
14.809
|
|
4
|
-8.838
|
15.662
|
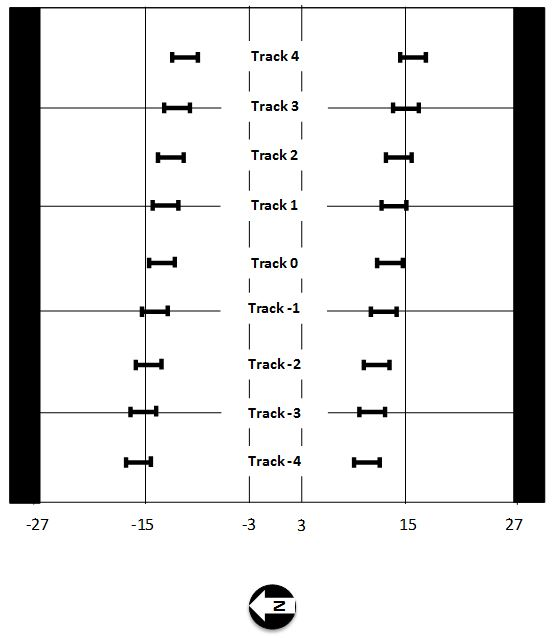
CC8 Phase 1 Overload Wander Pattern (Click to Zoom)
Pavement Monitoring
During the full scale trafficking of the Phase 1 Overload section static and dynamic responses were monitored for both gauge failure and environmental changes. In addition, the overall pavement condition was monitored using manual distress surveying and SCI calculation.
Additional Resources
To be directed to the CC8 Phase 1 Overload Comprehensive Test Plan, click here.
To download the complete wander table used for the Phase 1 Overload Traffic Test, click here.
Return to Construction Cycle 8 Overview