CC8 Phase 4 Strength & Fatigue Inner Lanes Traffic Test Results & Analysis
The CC8 Phase 4 Strength/Fatigue (S/F) tests were conducted on four lanes of slabs. Information on full-scale trafficking on the two outer lanes was provided separately. This section focuses on the continuation of full-scale tests on the remaining 2 inner lanes.
Objective
Phase 4 of CC8 was aimed at determining the cracking strength and fatigue life of concrete slabs designed and built to FAA standards; hence, this phase is designated the Strength/Fatigue test. The primary objectives of the CC8 S/F test were to isolate the three phases of the bottom-up cracking mechanism as shown below, and estimate the fatigue life contribution of all three stages:
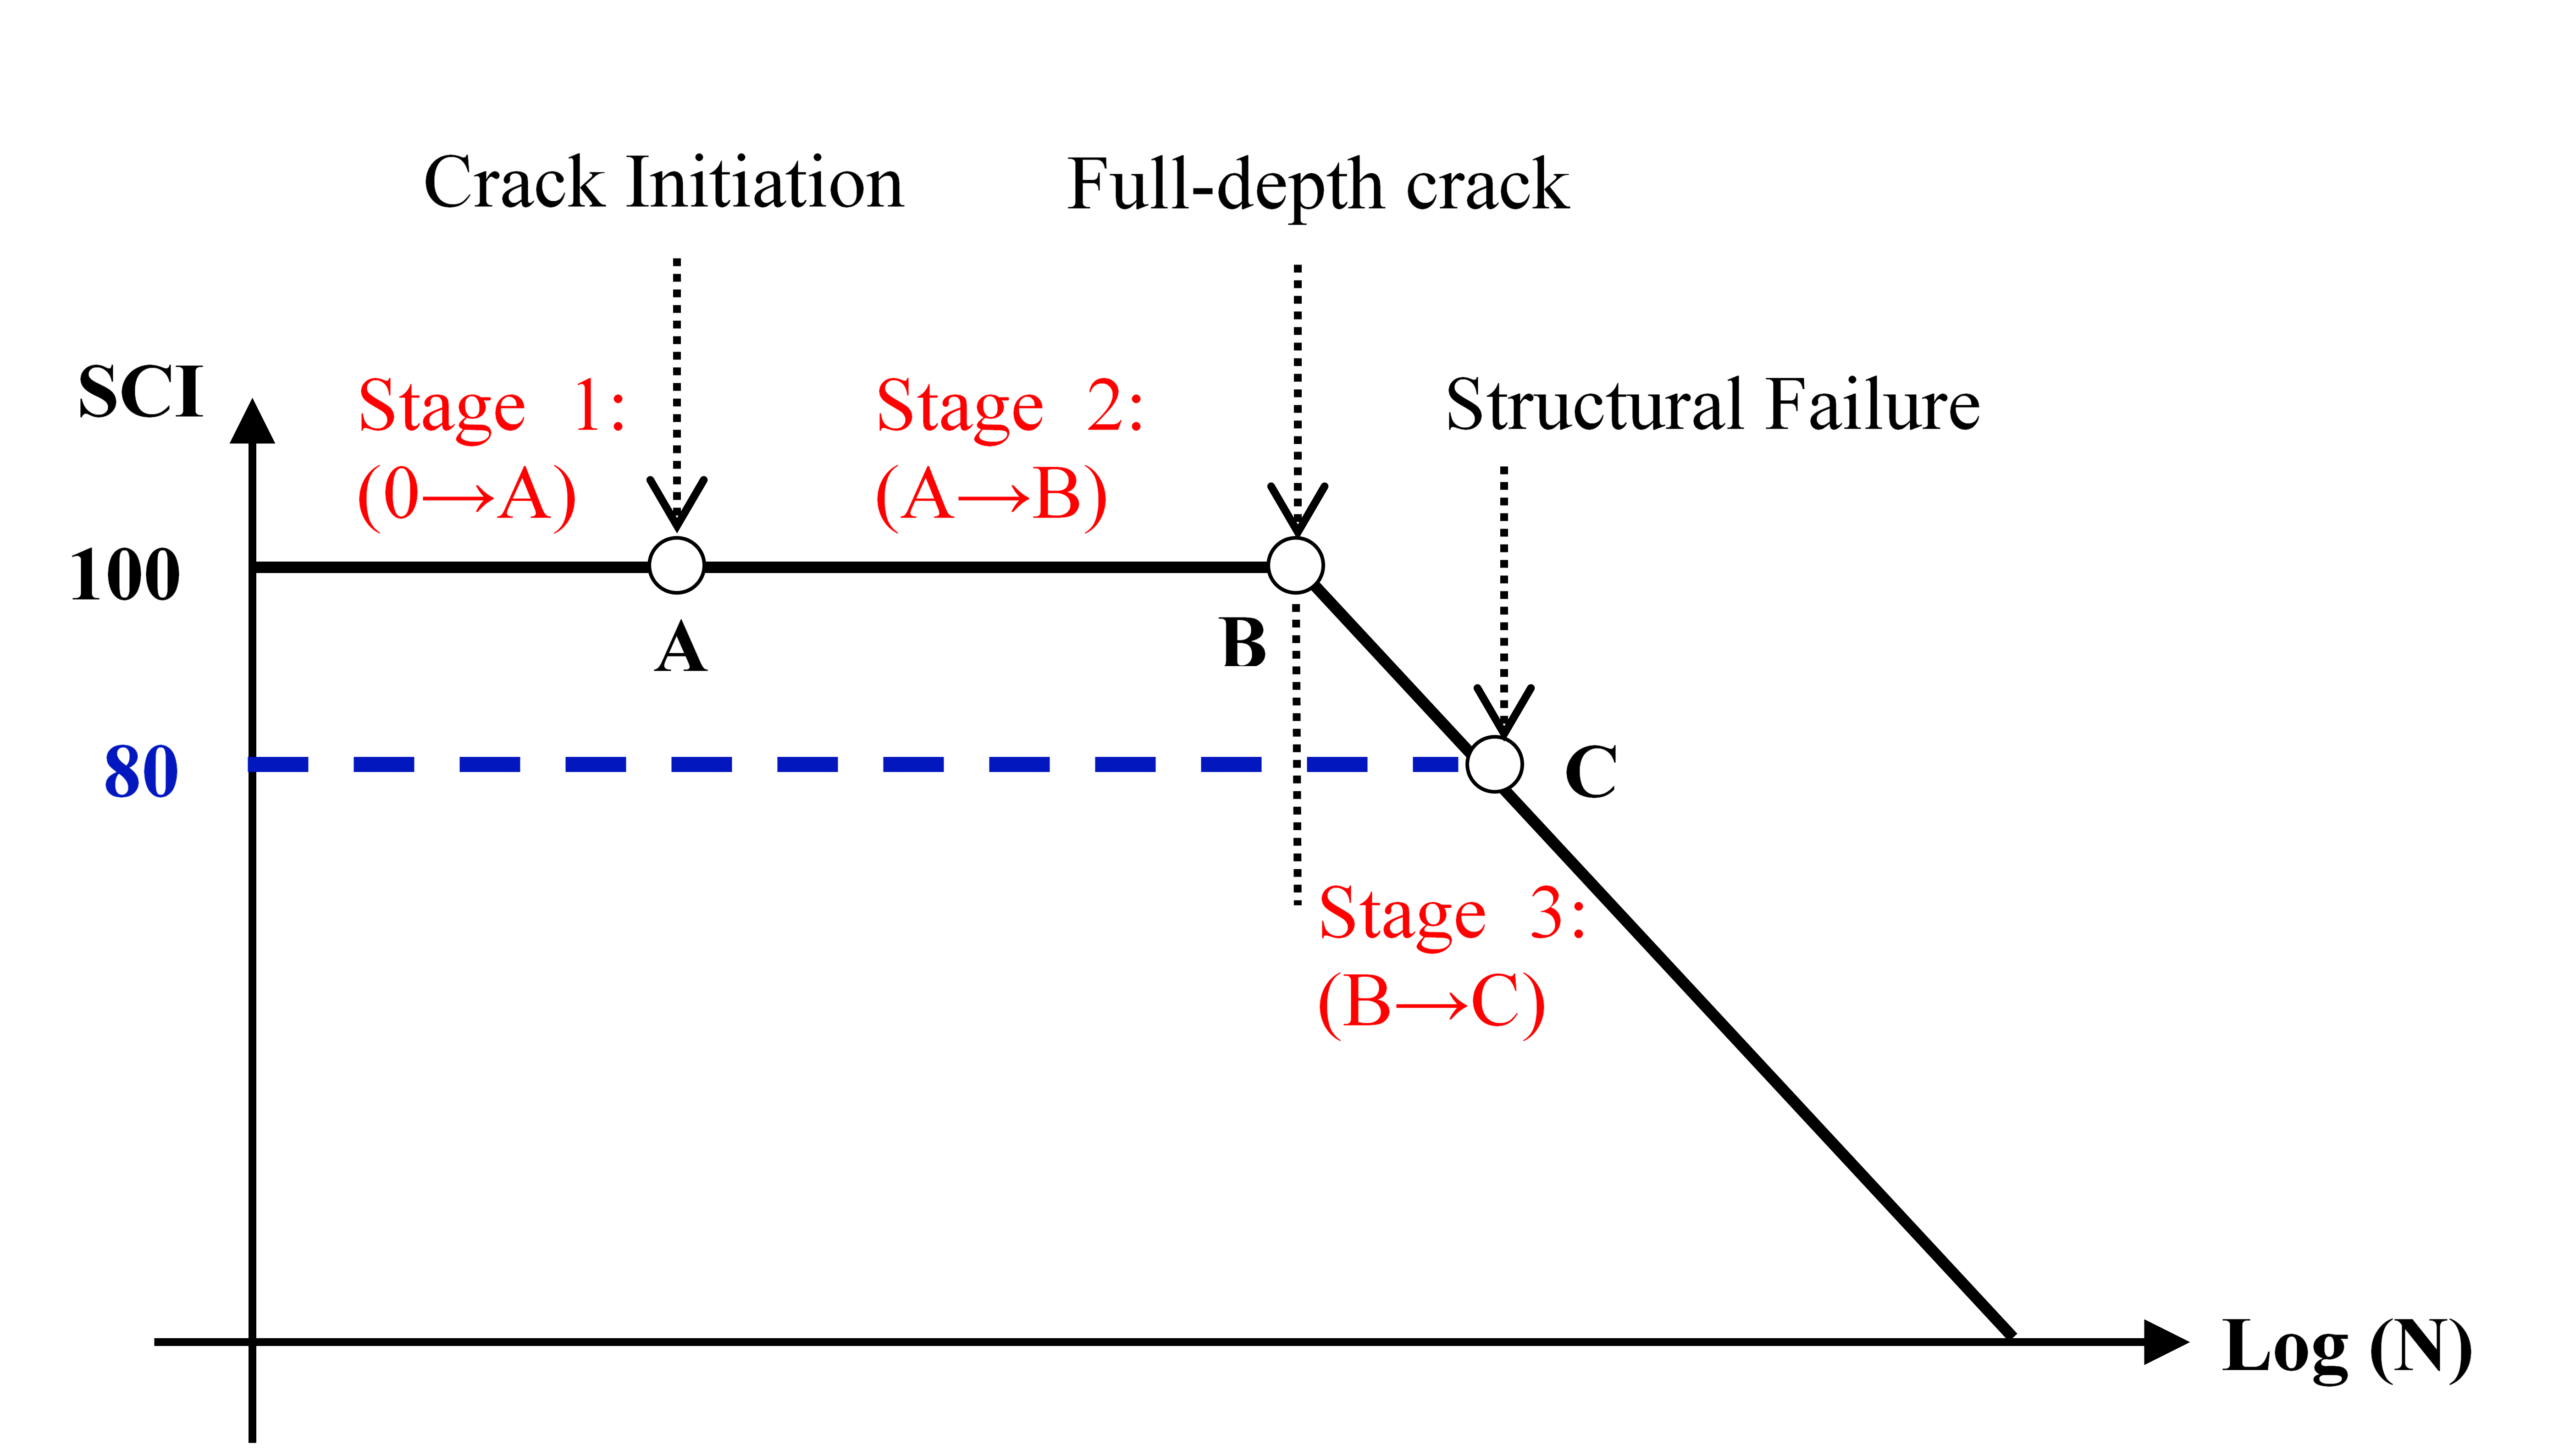
Rigid Pavement Failure Model in FAARFIELD (Reproduced from Guo et al. 2008) (Click to Zoom)
Full-scale tests were designed to obtain data from individual slabs regarding: (1) slab cracking strength for comparison to ASTM C78, Standard Test Method for Flexural Strength of Concrete (Using Simple Beam with Third-Point Loading); (2) bottom-up crack propagation in notched slabs (Stage 2 only); (3) crack initiation and propagation in unnotched slabs (Stages 1 and 2); and (4) the trade-off between concrete flexural strength and slab thickness as both factors affect fatigue life. In addition, the effect of subgrade strength is considered by including two California Bearing Ratio (CBR) values, 3-4 and 7-8.
Traffic Test Results
The full-scale tests on the inner lanes are conducted in two phases: static and moving load testing. The static load test is aimed at attaining the initiation of bottom-up cracking (Stage 1) in selected slabs of the north inner lanes. The notched slabs on the south are treated as pre-cracked, due to the weakened plane formed by the notch. The moving load test is aimed at achieving both crack initiation and propagation (Stage 1-3) in the non-pre-cracked slabs of the north inner lane. In pre-cracked and notched slabs on both north and south side, respectively, the moving load test is intended to cover only crack propagation (Stage 2 and 3).
Static Load Test (North)
During static load tests on the north inner lane, strain gauge data were collected over two days, August 22-23, 2018. Twelve inch thick slabs, SF1N and SF2N, and 9-inch thick labs, SF5N and SF6N, were initially subjected to the static load using D module. After reaching maximum load capacity (75,000 lbs) with no indication of bottom-up cracking from transverse EG responses, cracking loads were then achieved using the S module which allowed further increase to the wheel load. The data below were obtained in a static load test to initiate a bottom-up crack in slab SF2N. The NAPTV S module was positioned as described and illustrated in the Wander Behavior/Static Load section here. The same procedure as in static load tests for outer lanes was followed until the lower strain gauge in SF2N indicated a rupture at the slab bottom. The relationship observed between the recorded strain and applied load in the figure was approximately linear at low load levels. Then, it flattens at approximately 90,000 lbs before turning highly nonlinear at an inflection point corresponding to 110,000 lbs, which indicates the crack formation. The table below summarizes cracking loads and associated strains from the static load tests.
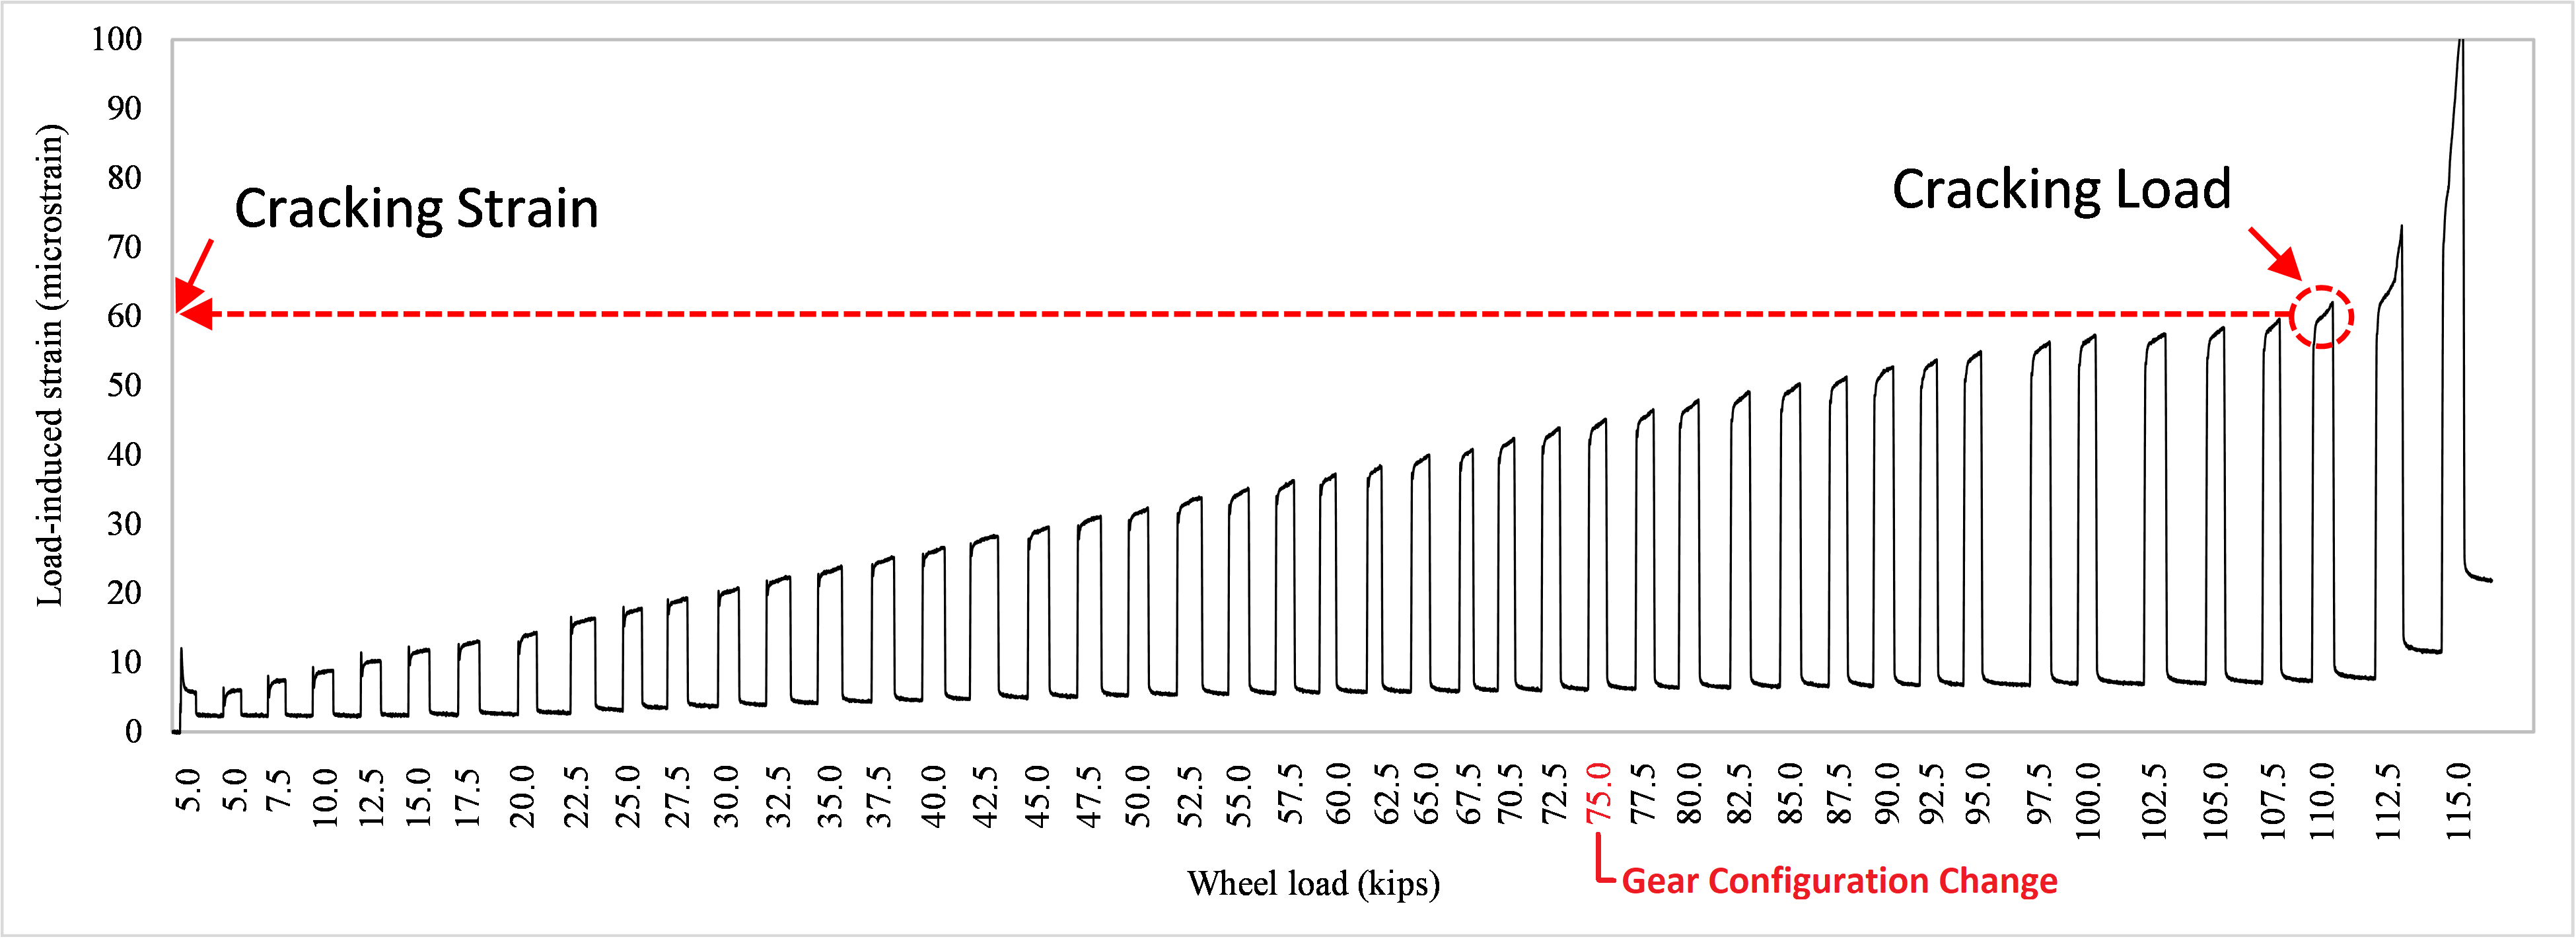
Example of Static Load Test on the North Inner Lane, Slab SF2N - Strain vs. Load (Click to Zoom)
Summary of Static Load Test Results
|
Slab ID
|
Thickness (inch)
|
R
|
Cracking Load (lbs)
|
Cracking Strain1 (microstrain)
|
|
SF1N
|
12
|
650
|
107,500
|
55.8
|
|
SF2N
|
110,000
|
55.6
|
|
SF5N
|
9
|
900
|
85,000
|
58.8
|
|
SF6N
|
92,500
|
68.3
|
R is concrete flexural strength.
Moving Load Test (North and South)
After completing the static load tests on slabs SF1N, SF2N, SF5N, and SF6N of the north inner lane for crack initiation, the next step was to apply moving loads for crack propagation. In the case of non-pre-cracked slabs SF3N, SF4N, SF7N, and SF8N (north inner lane), the crack initiation will be first achieved “naturally” by the moving gear load and then followed by the crack propagation phase. In the case of notched slabs SF1S-SF8S (south outer lane), the moving load test comprised only the crack propagation phase. Moving load traffic tests on the inner lanes began on October 16, 2019. The moving load test with zero-wander (along a single track) is conducted simultaneously on the north and south inner lanes using the NAPTV D module, at a nominal tire pressure of 220 psi.
The traffic loads, set at 80% of the average bottom-up cracking load, were 87,000 lbs on 12 inch-thick slabs and 71,000 lbs on 9 inch-thick slabs. These loads were equally distributed between the D module wheels at 40% per wheel and applied on tracks N2 and S2. A total of 25,000 passes have been applied to both the north and south inner lanes as of March 6, 2020. EG strain responses did not provide any clear indication of bottom-up crack initiation in the intact unnotched slabs. Also, no signs of crack propagation caused by the moving load test were observed on the surface. CC8 S/F moving load test paused on March 2020 due to the COVID-19 pandemic and facility shutdown. To date, resumption of traffic for completion of the CC8 S/F moving load test on inner lanes is still pending.
Behavior of Test Section under Traffic
Distress Mapping
Cumulative passes applied with D module on the inner lanes are 25,000 as of March 6, 2020. Prior to the moving load tests, 50 passes were applied on July 15, 2019 to both north and south inner lanes as a separate effort in preparation for CC9 data collection. This resulted in an unintended crack on SF3S (12-inch thick, R=650 psi and CBR 7-8) along the inner wheel path. After the traffic test commenced on October 16, 2019, only one diagonal crack was recorded on T3-1N (transition slab at west end of CC8 S/F test area). This distress was observed on October 18, 2019 after 838 cumulative passes. Neither north nor south inner lane slabs on the actual CC8 S/F test area have shown any additional surface distress. The figures below show current distress maps for slab groups 1-4 and 5-8, respectively.
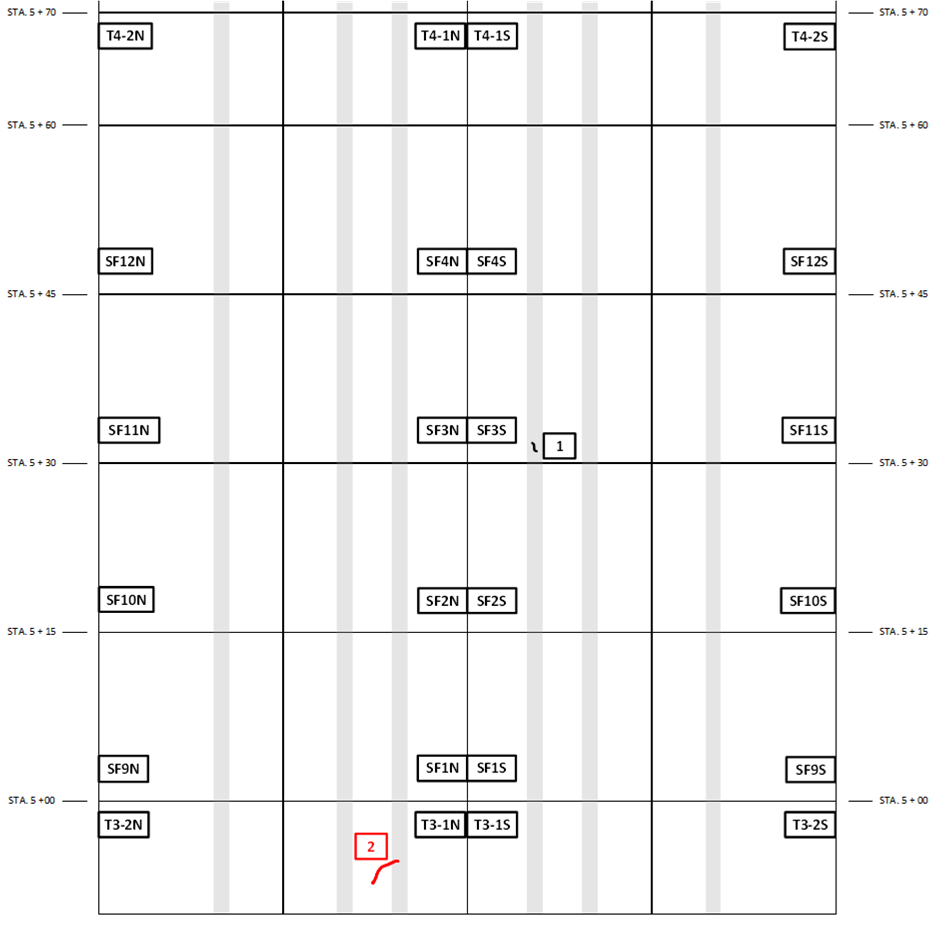
Distress Map after 25,000 Passes on Inner Lanes (Groups 1-4, Last Updated: March 19, 2020) (Click to Zoom)
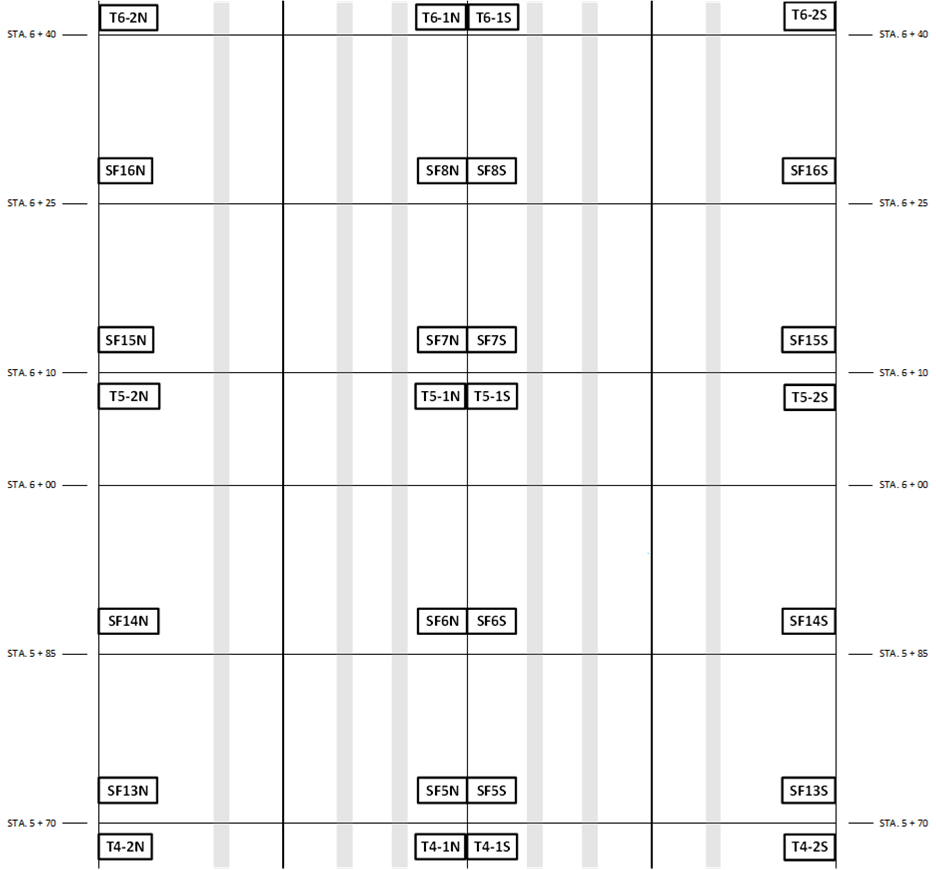
Distress Map after 25,000 Passes on Inner Lanes (Groups 5-8, Last Updated: March 19, 2020) (Click to Zoom)
Characterization of Crack Propagation
Crack development at the surface is recorded by daily distress surveys. Cumulative passes corresponding to the first appearance of bottom-up cracks and full-length propagation of longitudinal cracks as shown here (when crack connects both west and east end of the slab) are required for the characterization of crack propagation. To date, isolating the three phases of fatigue failure (crack initiation, full-depth, and full-length crack propagation) is not possible due to the lack of performance data. Characterization of crack propagation will be done after completion of the moving load test.
Observations and Preliminary Findings
Distress, instrumentation, and field-testing data collected were reviewed and analyzed. Observations and preliminary findings of this study are summarized below.
Instrumentation and Field Testing
- The strain response of EGs installed at the top and bottom of slabs was used to monitor crack initiation, full-depth, and full-length propagation. Throughout the 25,000 cumulative passes completed as of March 19, 2020, EG strain responses did not provide any clear indication of bottom-up crack initiation in the intact unnotched slabs.
- PSPA tests were conducted throughout the trafficking period to determine the change in concrete modulus. After 25,000 passes, the average modulus for 12 inch thick slabs (R = 650 psi) was less than that for 9 inch thick slabs (R = 900 psi). There was a positive correlation between R and concrete modulus. PSPA data showed no overall decrease in modulus that would indicate degradation in the structural integrity of slabs.
- In general, the impact stiffness modulus (ISM) derived from HWD test data indicated no degradation in slab integrity. Test items on subgrade with CBR 3-4 had higher ISM than those on subgrade with CBR 7-8 on both the north and south sides. (pavement cross-section figures) This suggests that the effect of subgrade strength may be offset by the variability in material strength of shallower layers (e.g., higher compressive strength of P-306MR observed for slab groups on subgrade with CBR 3-4 compared to groups on subgrade with CBR 7-8).
Cracking Strength
- The load-related stress, causing rupture of the PCC slabs, were determined under static loads. These CC8 load-related stress levels were below 55% of the concrete flexural strength of field cured beams. In the previous CC6 strength tests (Yin, 2011), the estimated rupture stress at the bottom extreme fiber (as derived from EG response data) was close to the concrete flexural strength. This discrepancy between CC8 and CC6 is most likely due to the presence of non-load-related built-in stresses in the slab.
Moving Load Tests
- Moving loads were applied to the inner lane slabs for full-depth and full-length crack propagation (and crack initiation in the case of not pre-cracked slabs). However, no surface distress was observed on the slabs after 25,000 cumulative passes. Therefore, the effect of concrete flexural strength and thickness as well as subgrade strength cannot be evaluated at this point. The comparison of notched versus unnotched slabs was also unfeasible due to the lack of performance data.
- The effect of concrete flexural strength and thickness based on the state of stress was investigated. Current stress ratios were calculated as the ratio of the stress at the slab bottom fiber to R. It was observed that stress ratios on 12-inch slabs were smaller than 9-inch slabs, indicating a possible delay in crack initiation (Stage 1) for 12-inch slabs as it was observed during the traffic tests on outer lanes.
- The effect of subgrade strength was preliminarily investigated based on the state of stress. Load-induced stresses were estimated at the bottom of intact slabs over subgrade of CBR 7-8 (SF5N and SF6N), and subgrade of CBR 3-4 (SF7N and SF8N). The load-induced stress in slabs over subgrade of CBR 7-8 was lower than those over subgrade of CBR 3-4. Therefore, longer fatigue life for slabs on subgrade of CBR 7-8 may be anticipated.
Field Experiment Versus FAARFIELD
- The initial FAARFIELD predictions were updated using load-induced stress derived from EG strain responses during the moving load test. The revised predictions showed an extreme increase in the number of coverages required to complete Stage 1+2 and Stage 3. This is mainly attributed to the observed increase in the design factor (DF) values of the FAARFIELD rigid pavement failure model. The revised analysis indicated that no surface distress should be expected within a reasonable timeframe if trafficking is continued using the D module with 80% of the bottom-up cracking load equally distributed between the two wheels (40% per wheel).
- For accelerating the occurrence of surface distress, the DF values must be lowered by increasing the wheel load. Considering both fatigue life and DF values reported during CC8 S/F traffic test on the outer lanes, it was recommended to resume traffic on the inner lanes using the S module with increased wheel load level equivalent to 80% of the cracking load. These wheel load levels are 87,000 lbs and 71,000 lbs for 12- and 9-inch slabs, respectively.
Additional Resources
To be directed to the CC8 Phase 4 Strength & Fatigue Test Database, click here.
To download the CC8 Phase 4 Strength & Fatigue Traffic Test Report — Inner Lanes, click here.
Return to Construction Cycle 8 Overview