CC8 Phase 4 Strength & Fatigue Outer Lanes Traffic Test
The National Airport Pavement Test Vehicle (NAPTV) in the NAPTF is a rail-based test vehicle capable of simulating an aircraft weighing up to 1.3 million pounds. The NAPTV consists of two carriages, a north carriage and a south carriage, each that can accommodate up to five load modules. Each load module can support two wheels, allowing for configurations of up to 20 wheels. The NAPTV can apply loads of up to 75,000 pounds per wheel and simulates aircraft wander by varying the lateral position of the carriages.
Gear Configuration
For the Phase 4 Strength/Fatigue test on the outer lanes, a single wheel (S) module was used on both north and south carriages for static and moving load test (see figure below). Also, all applied traffic was zero-wander (i.e., traffic applied over a single transverse position) with vehicle speed limited to 2.5 mph.
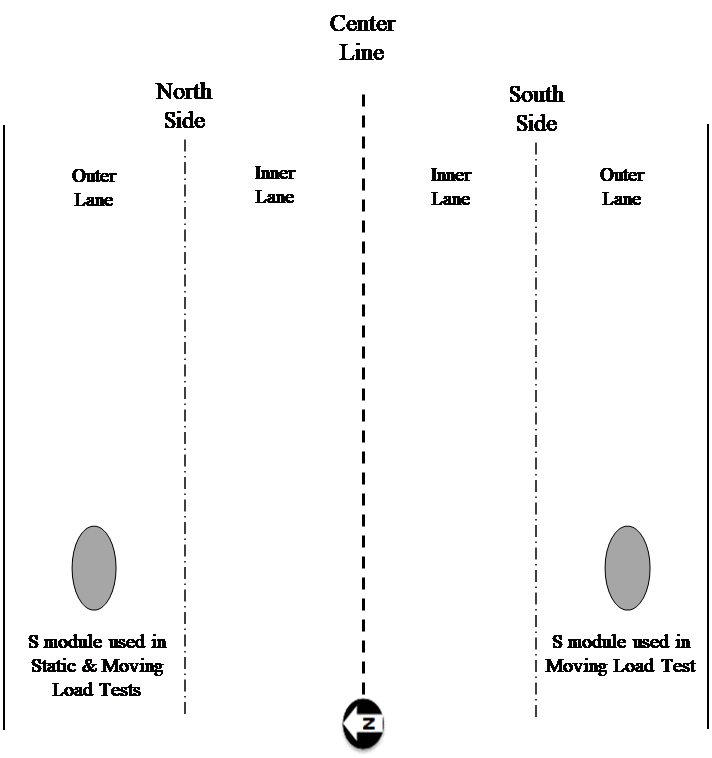
Gear Configurations used in CC8 Phase 4 S/F Test (Outer Lanes) (Click to Zoom)
Pre-Trafficking
Prior to full scale trafficking on the Phase 4 Strength/Fatigue test area, the pavement was trafficked using a two-wheel (D) gear configuration at 10,000 lbs per wheel on both carriage 1 and 2. As shown in the figure below, the special seating load pattern consisted of 21 tracks spaced every 10 inches to cover the entire pavement width (except for areas near shoulders that are out of range of the load carriage). During seating, the vertical movement of slab corners were monitored with Eddy Current Sensors (ECS).

Seating Load Wander (Click to Zoom)
Following the seating load wander, baseline HWD tests were performed at the NDT locations specified in the painting plan. The HWD testing was conducted with a four-drop loading sequence beginning with an approximate 36,000 lbs seating load. The subsequent loads were approximately 12,000 lbs, 24,000 lbs, and 36,000 lbs. The HWD measurements were used to back-calculate layer moduli, and as a reference baseline to monitor subsequent slab curling and changes in support conditions.
Full-Scale Trafficking
The current Federal Aviation Administration (FAA) design procedure for rigid (concrete) airport pavements adopts the failure model proposed by Rollings (1988), where the Structural Condition Index (SCI) was introduced as a measure of pavement performance (AC 150/5320-6F 2017). In this failure model (shown in the figure below), the SCI deteriorates as an approximately linear function of the logarithm of coverages. On the flat regime, point A represents the number of coverages corresponding to the bottom-up crack initiation. The number of coverages at which SCI begins to diminish from its initial level of 100 (i.e., corresponding to the first observed through crack on the surface) is defined as point B. Point C (SCI 80) is the FAA definition of structural failure.
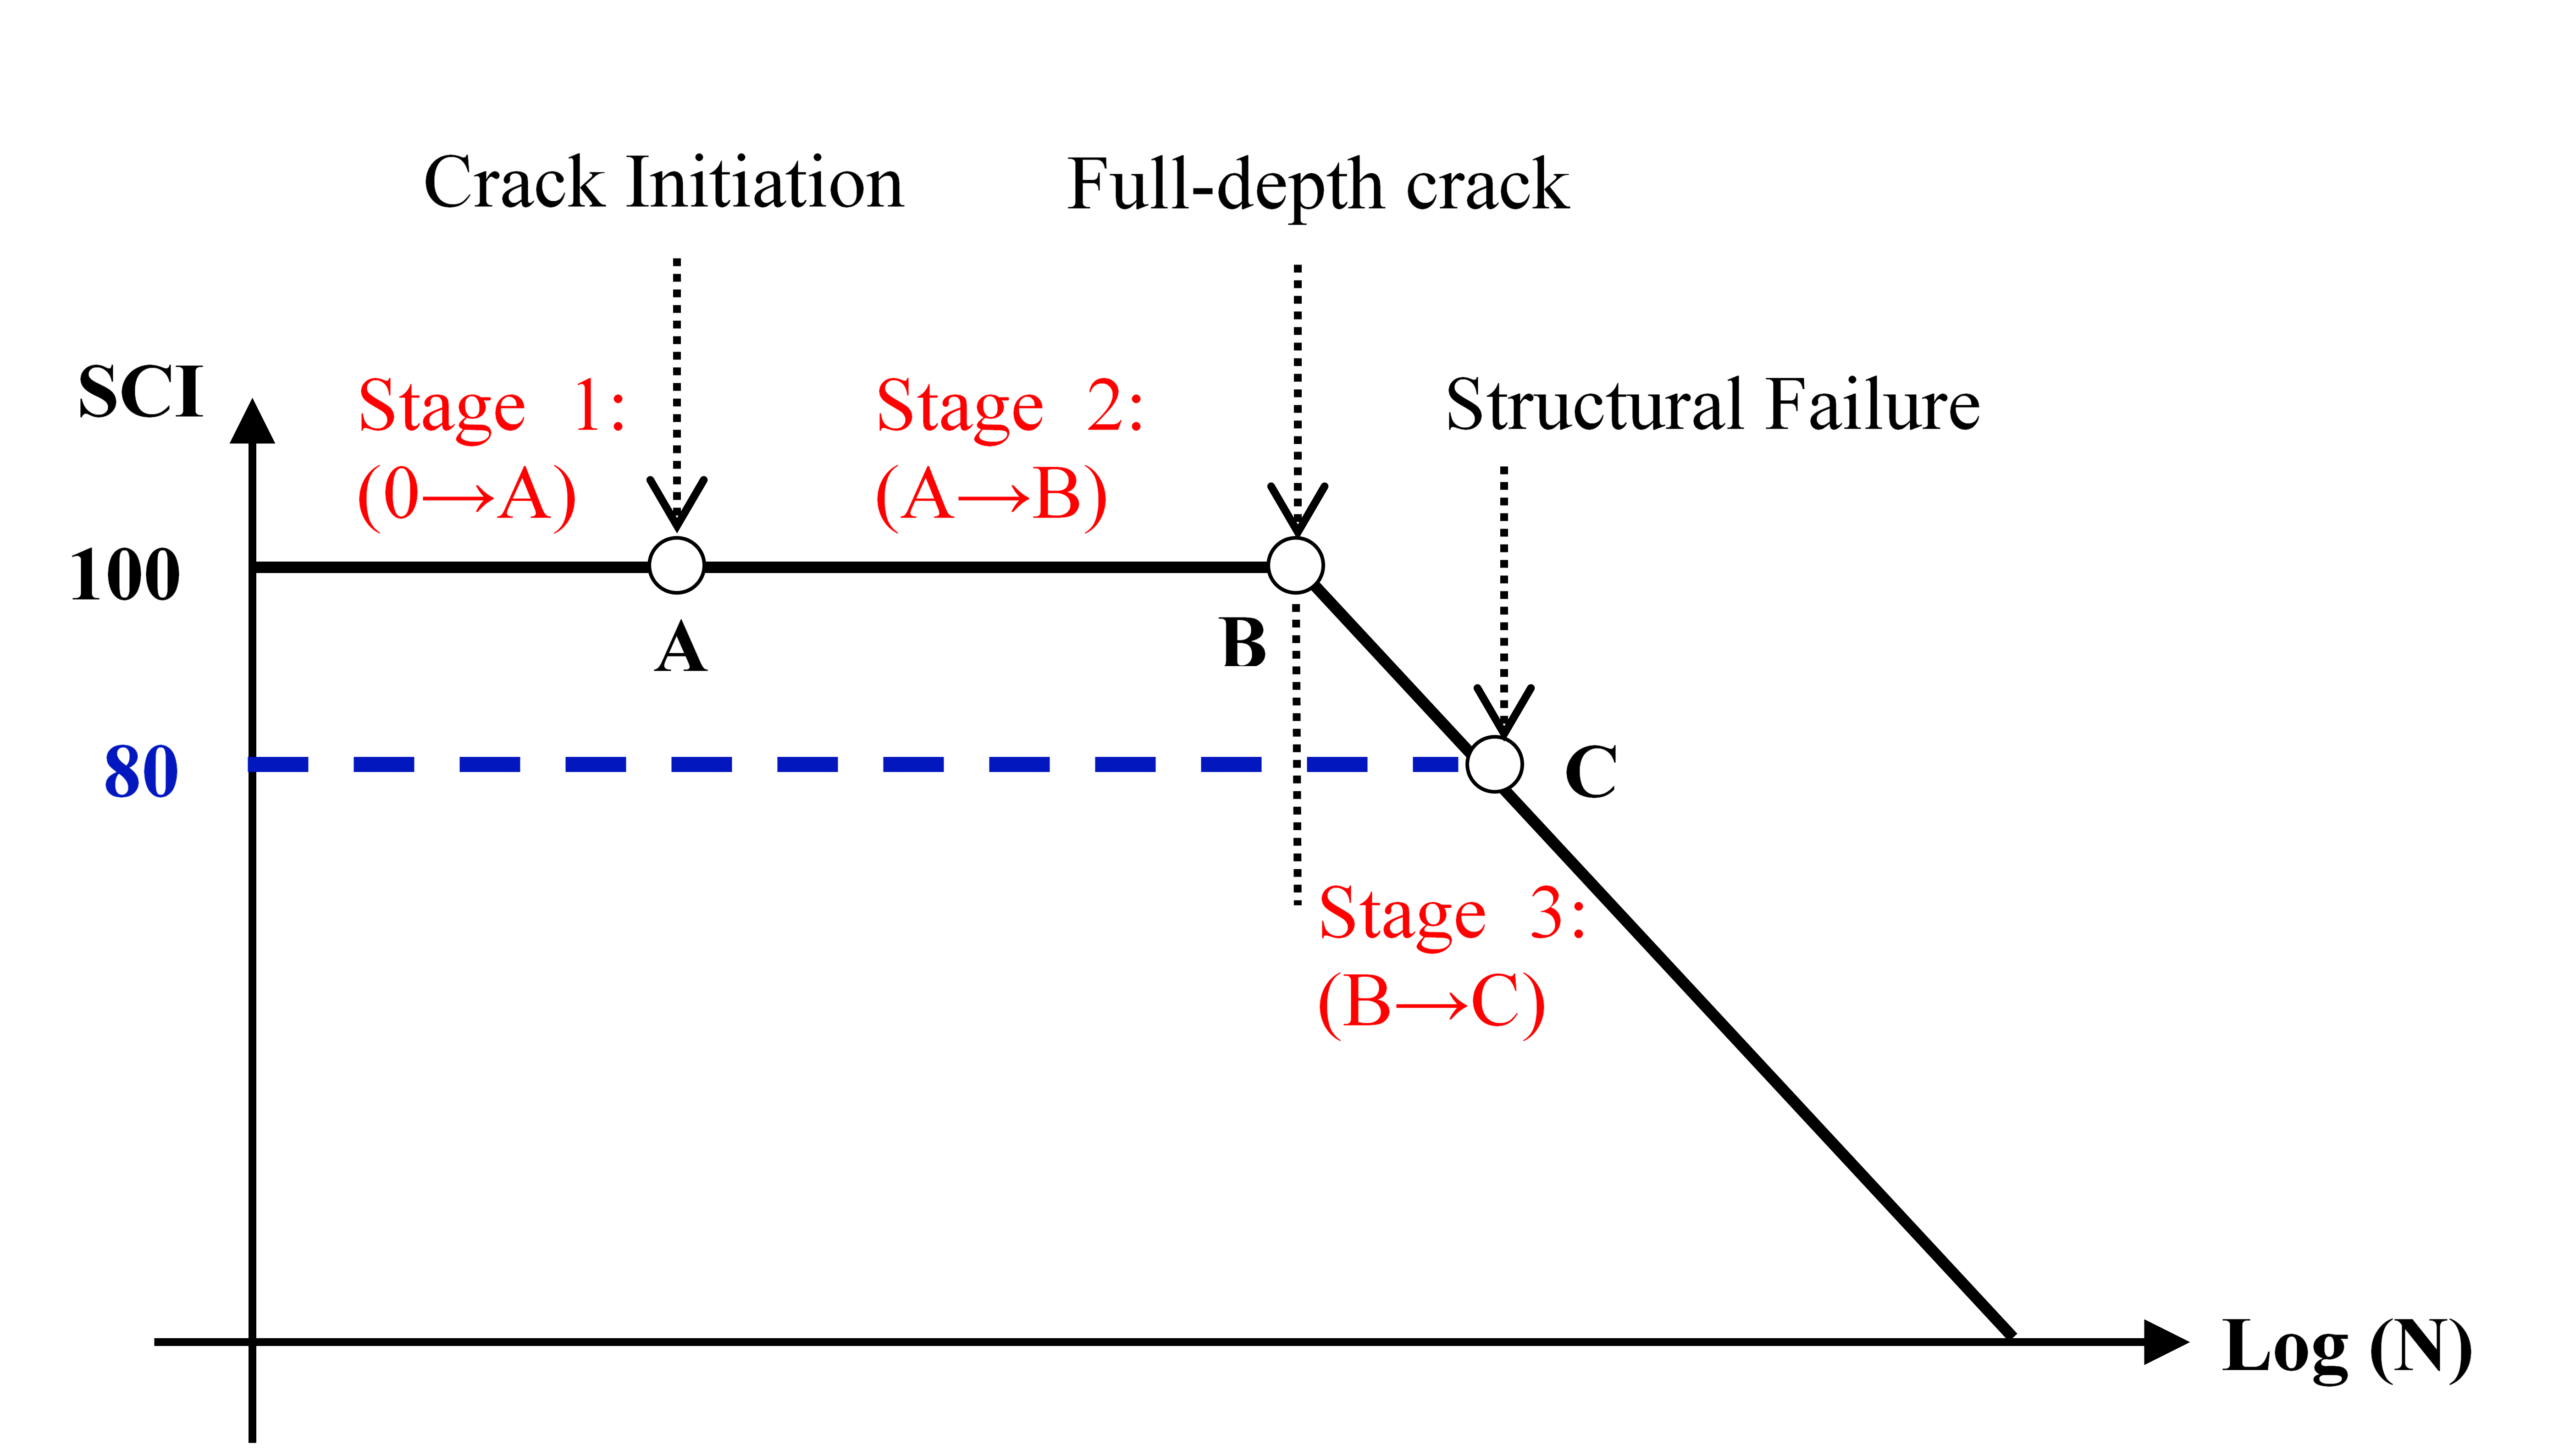
Rigid Pavement Failure Model in FAARFIELD (Reproduced from Guo et al. 2008) (Click to Zoom)
The Phase 4 Strength/Fatigue test started with static-load crack initiation (Stage 1) tests to determine the cracking strength of selected slabs. For outer lanes on the north side (slabs SF9N-SF16N), the static load was applied through the NAPTV using a S module, which can develop up to 150,000 lbs. In the case of non-precracked slabs SF9S-SF16S on the south outer lanes, the crack initiation was first achieved “naturally” by the moving gear load and then followed by the crack propagation phase (Stage 2 and 3).
After the completion of static-load tests for crack initiation, the test proceeded to apply moving loads for crack propagation (and crack initiation in the case of non-precracked slabs). Traffic load equivalent to 80% of the bottom-up cracking load was applied. Trafficking continued until full-length crack propagation was attained on every slab of each outer lane. The traffic tests conducted on the outer lanes during Phase 4 Strength/Fatigue are summarized in the table below.
Summary of CC8 Phase 4 Strength/Fatigue Traffic Tests (see slab groups in figure below)
|
Crack Initiation
|
Crack Propagation
|
|
Group1
|
Test Item
|
Lane
|
Static Load
|
Moving Load
|
Group1
|
Test Item
|
Lane
|
Moving Load
|
|
1, 3, 5, 7
|
North
|
Outer
|
S
|
-
|
1, 3, 5, 7
|
North
|
Outer
|
S
|
|
2, 4, 6, 8
|
South
|
Outer
|
-
|
S
|
2, 4, 6, 8
|
South
|
Outer
|
S
|
1Details on slab groups are provided in the figure below
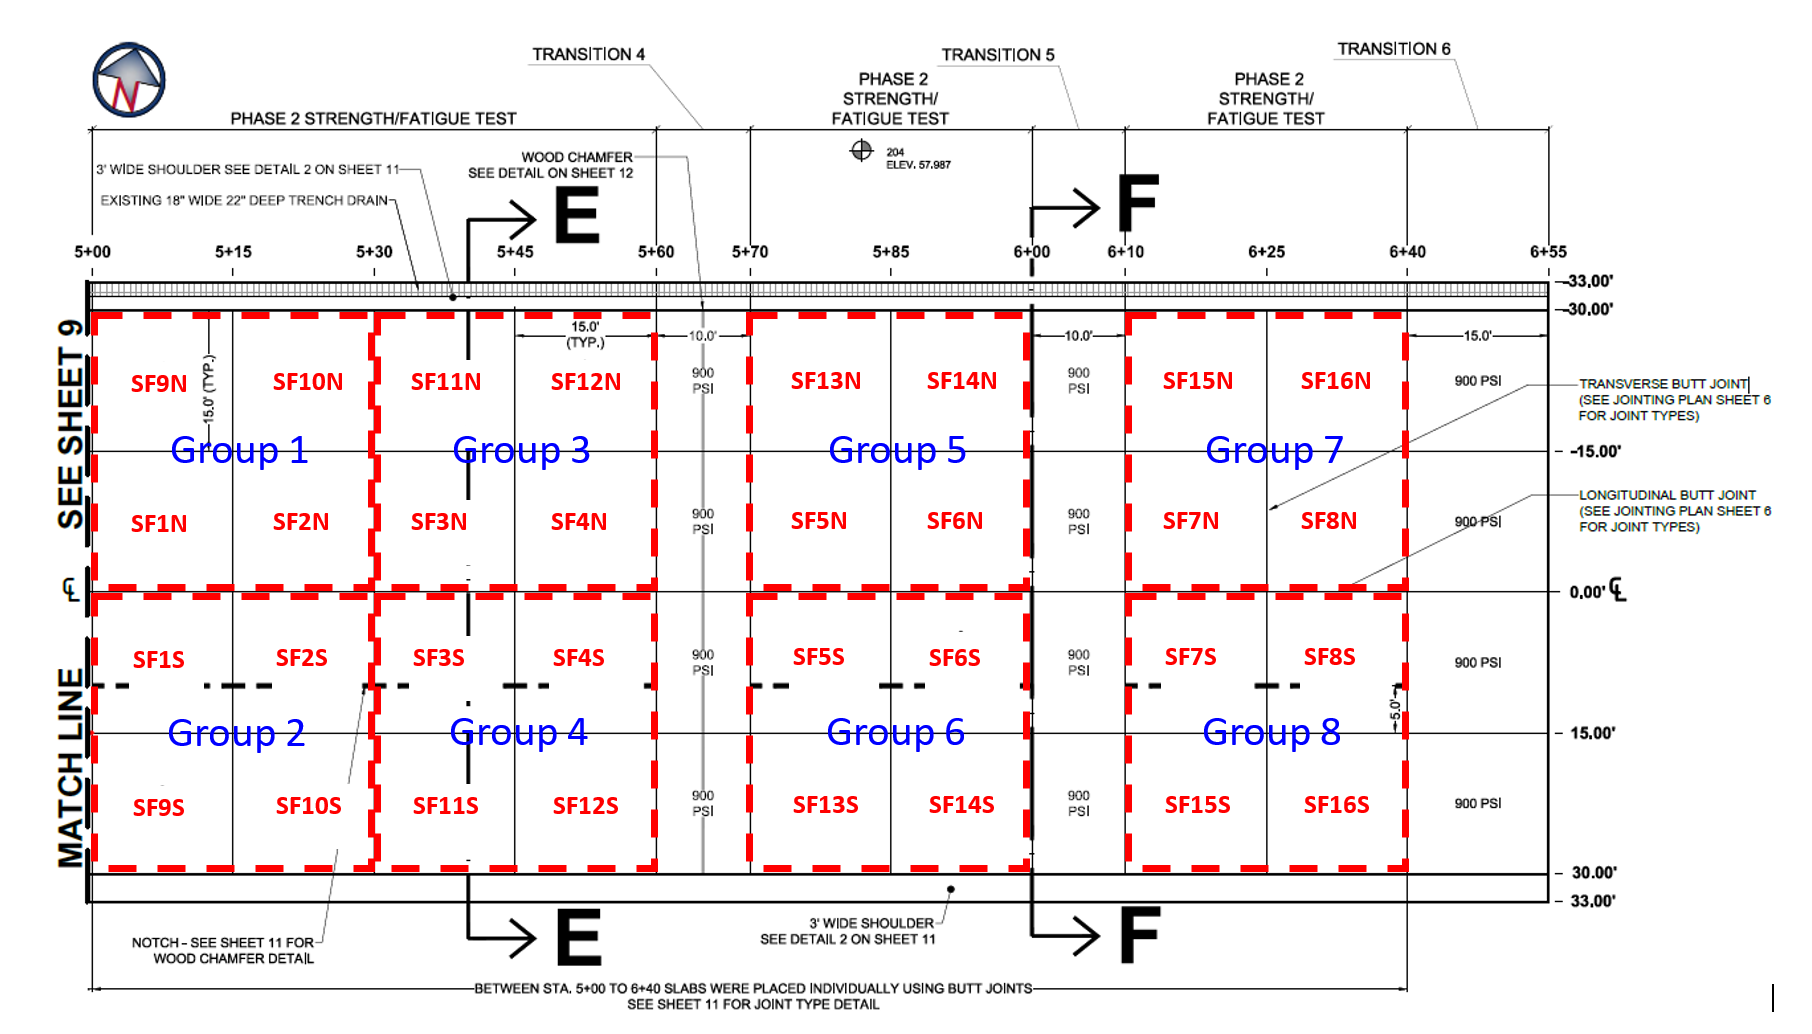
Slab Groups in CC8 Phase 4 – Strength/Fatigue Test Pavement (Click to Zoom)
Wander Pattern
Static Load
Static load tests were performed to initiate bottom-up cracks (Stage 1) at transverse joints on the north side. Single wheel load was applied on the outer lane slabs SF9N-SF16N. As shown in the figure below, the NAPTV was positioned such that the forward edge of the tire print (S module) was aligned with the transverse slab edge, and directly over the EG pair. This position produces the maximum tensile stress at the slab bottom.
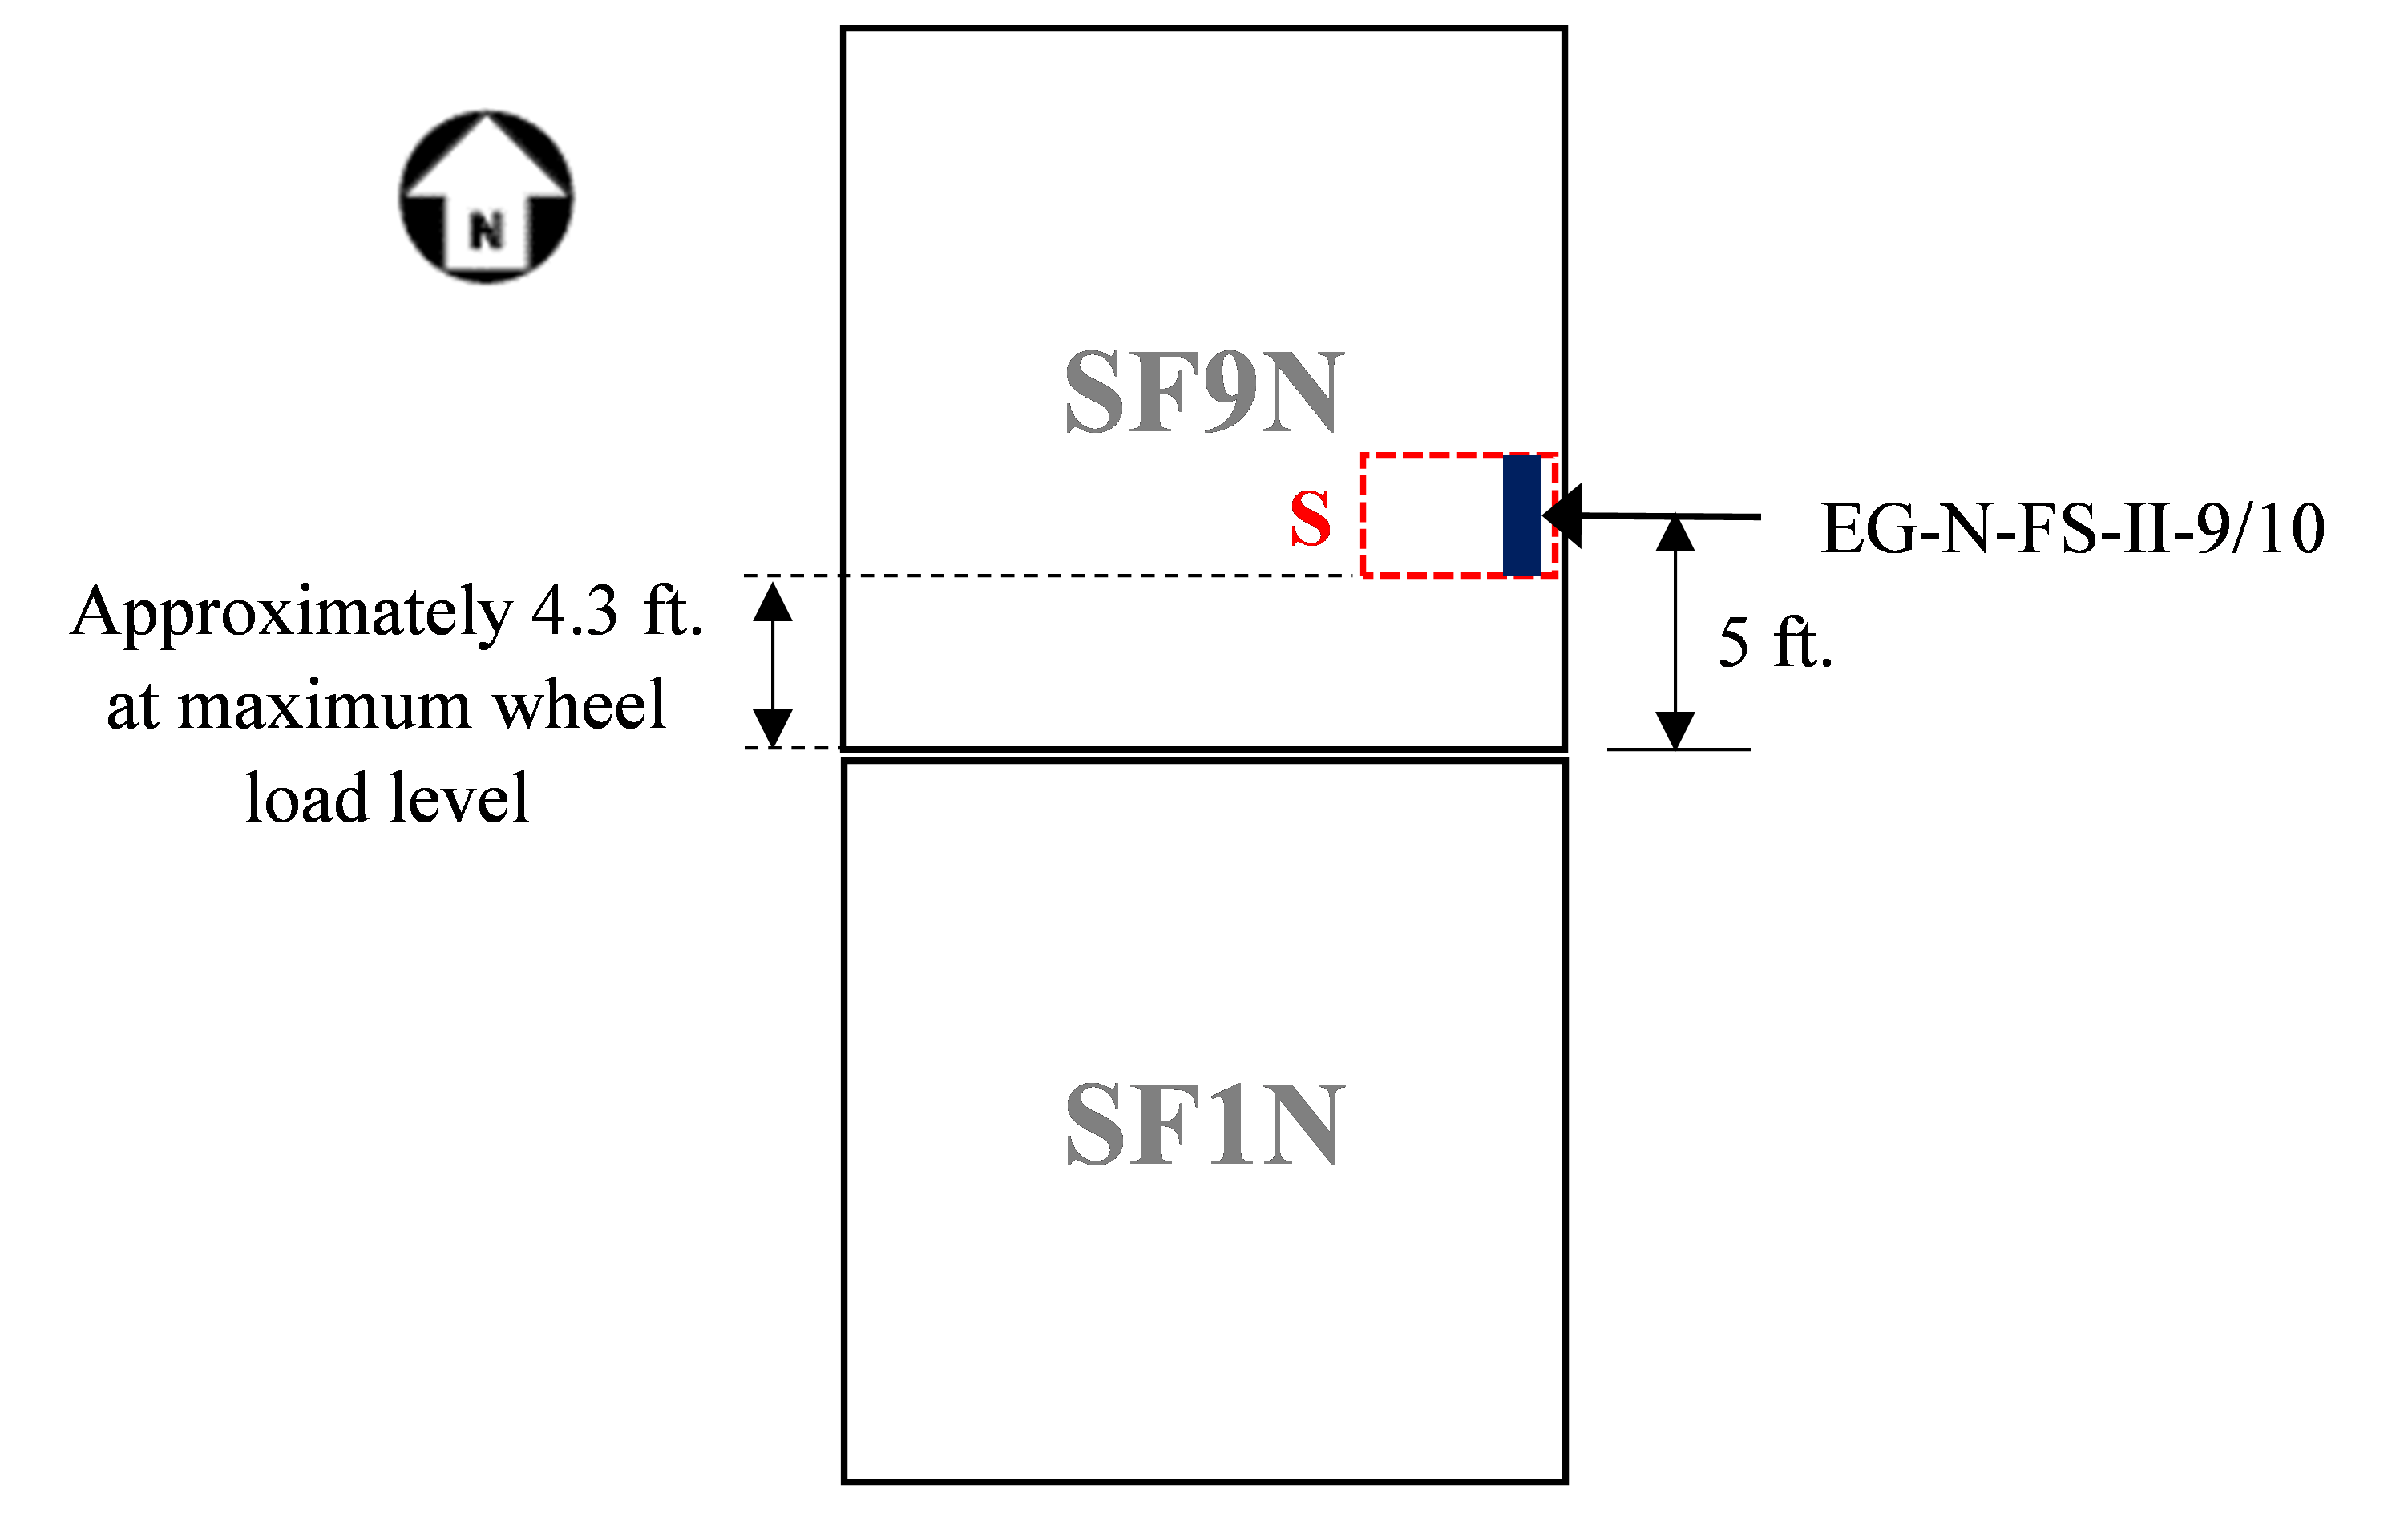
Position of S NAPTV Module for Static Load Tests (Click to Zoom)
Moving Load
Crack Initiation
Zero-wander traffic was applied to both north and south side for the moving load tests. The S module was used for crack initiation (Stage 1) of the entire outer lane on the south (groups 2, 4, 6 and 8). Following tracks N1 and S1 in the figure below, the NAPTV carriages were positioned such that the module traveled directly above the EG pairs of interest. Note that tracks N1 and S1 are specific for this test, and are not related to any of the wander patterns used to approximate a normal distribution of aircraft traffic in previous construction cycles. Following procedures developed for the earlier CC6 Strength Test (Guo et al., 2012), the traffic loads were set at 80% of the average cracking loads from the static tests. Trafficking continued until the strain responses indicated rupture at the gage location.
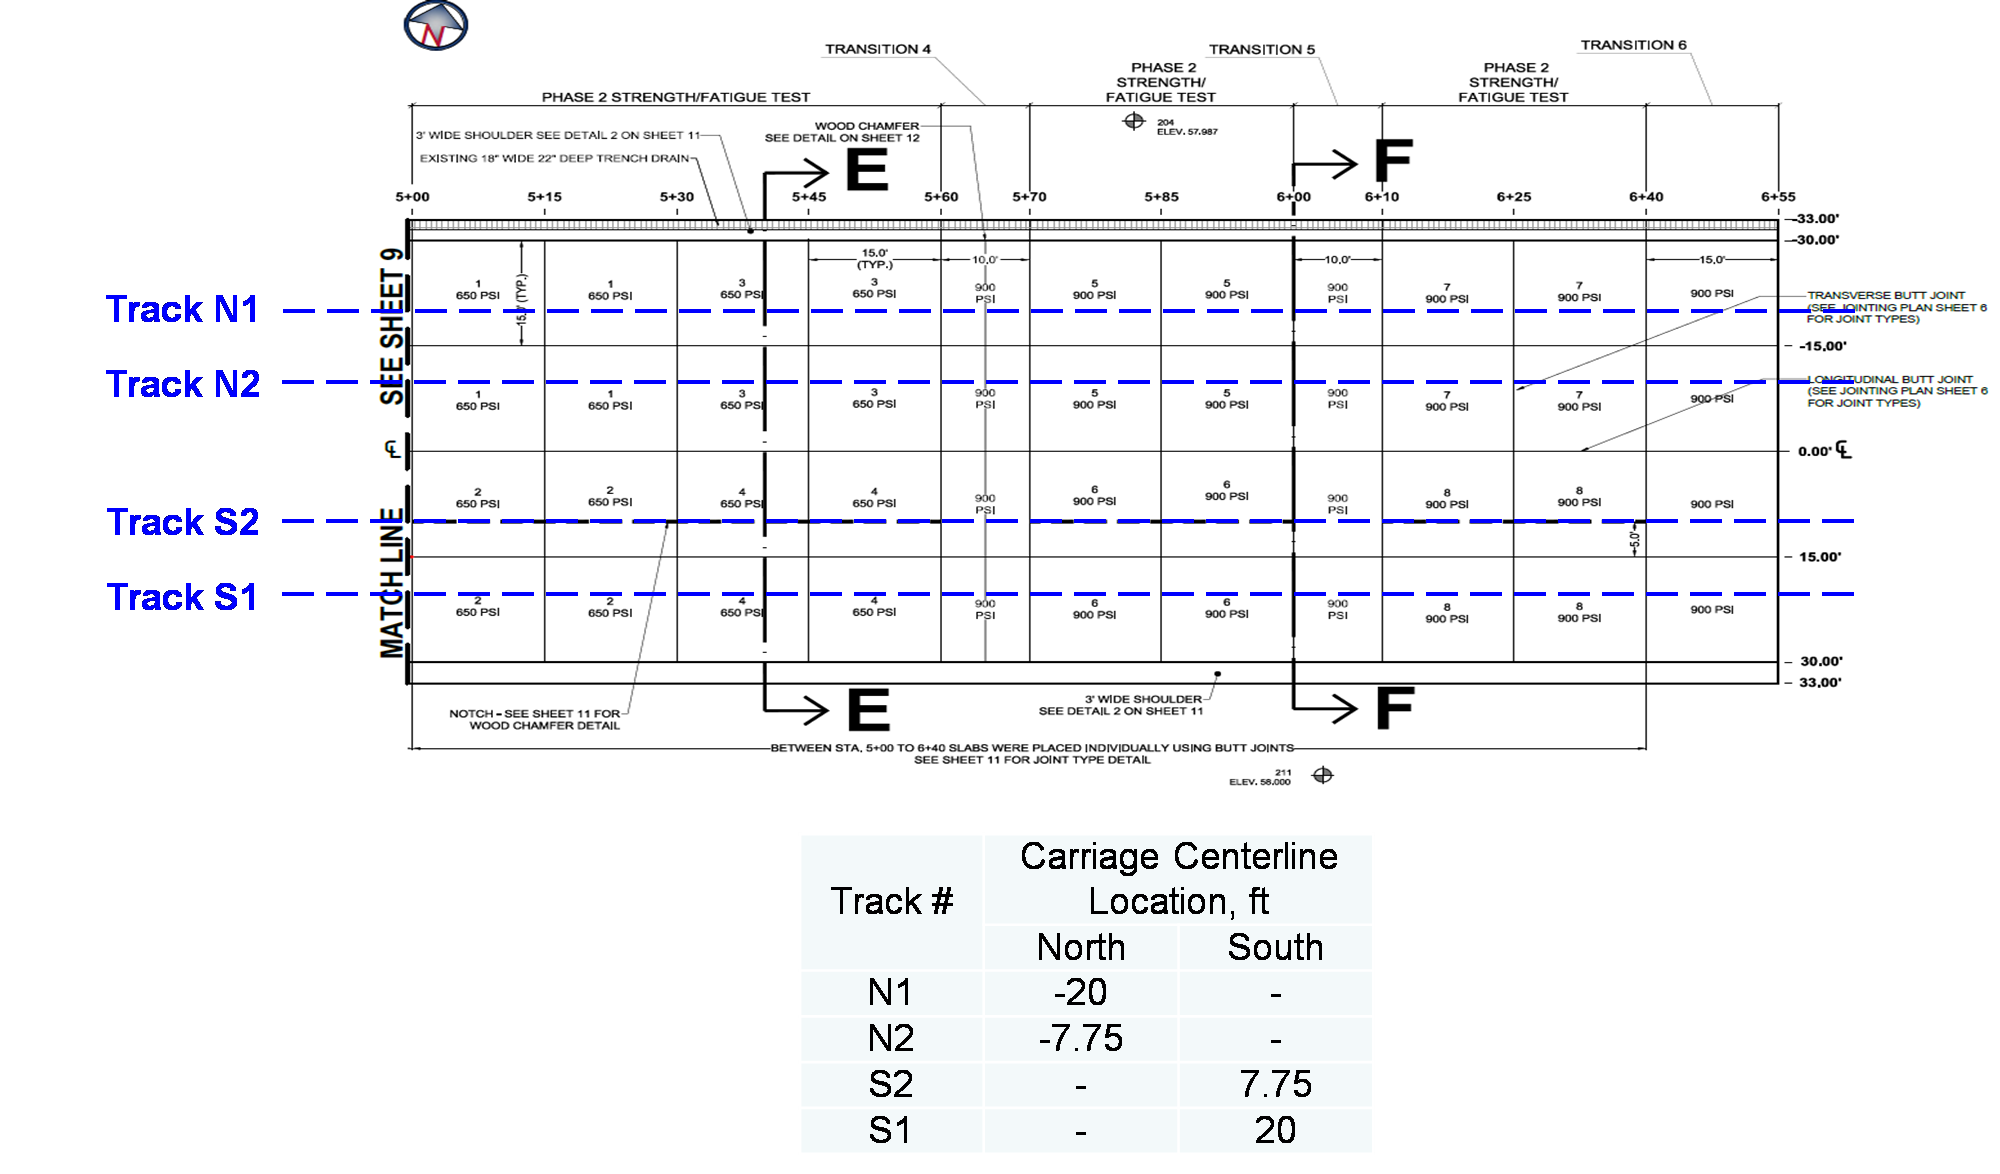
NAPTV Module Tracks for Moving Load Tests (Click to Zoom)
Crack Propagation
Once bottom-up cracks were initiated, additional traffic at 80% of the bottom-up cracking load was required to complete crack propagation, characterized by the development of a full-depth (Stage 2) and full-length (Stage 3) crack. On both the north and south side, the S module was used to propagate cracks to the surface on outer lanes. The vehicle speed was 2.5 mph traveling in both West to East (W→E) and East to West (E→W) directions at the transverse gear positions shown in the figure above.
Pavement Monitoring
During the full-scale trafficking of the Phase 4 Strength/Fatigue test area, static and dynamic responses were monitored for both gage failure and environmental changes. In addition, the overall pavement condition was monitored using a manual distress survey. HWD and PSPA testing was also performed on a weekly basis to aid in monitoring the pavement condition.
Additional Resources
To be directed to the CC8 Phase 4 Strength & Fatigue Test Database, click here.
To download the CC8 Phase 4 Strength & Fatigue Comprehensive Test Plan, click here (Coming Soon).
To download the CC8 Phase 4 Strength & Fatigue Traffic Test Report — Outer Lanes, click here.
Return to Construction Cycle 8 Overview