Reflective Cracking Phase IV
Phase IV Test Summary
Full-scale tests started on February 12, 2015. After 3757 cycles, the test concluded on April 6, 2015.
Objective
The research objective was to predict the fatigue life of a given HMA overlay structure and materials using full-scale test data. The fatigue prediction should take into account all three-stage process involving crack initiation, propagation, and final failure.
Overlay Design
To maintain consistency with Phase III test, Phase IV test overlay consisted of two 5-ft wide overlay strips. Both strips have the same materials, FAA P-401 PG 64-22 HMA, but different overlay thicknesses (i.e., 5-in. vs. 7-in.). The gradation and volumetrics of the overlay HMA mix is provided in Table 1.
Table 1. Aggregate Gradation and Volumetric of Overlay HMA Mix
|
Sieve Size
|
Cumulative Percent Passing
|
|
Blended Aggregates
|
P-401 Spec
|
|
3/4'
|
100.0
|
100.0
|
|
1/2'
|
95.4
|
79-99
|
|
3/8'
|
87.5
|
66-88
|
|
#4
|
62.9
|
48-68
|
|
#8
|
36.9
|
33-53
|
|
#16
|
22.3
|
20-40
|
|
#30
|
15.1
|
14-30
|
|
#50
|
11.8
|
9-21
|
|
#100
|
8.9
|
6-16
|
|
#200
|
5.9
|
3-6
|
|
Maximum Specific Gravity
|
2.628
|
-
|
|
Bulk Specific Gravity
|
2.535
|
-
|
|
Optimum Asphalt Content (%)
|
5.0
|
4.5-7.0
|
|
Air Voids (%)
|
3.4
|
2.8-4.2
|
|
VMA (%)
|
15.4
|
>15.0
|
Construction
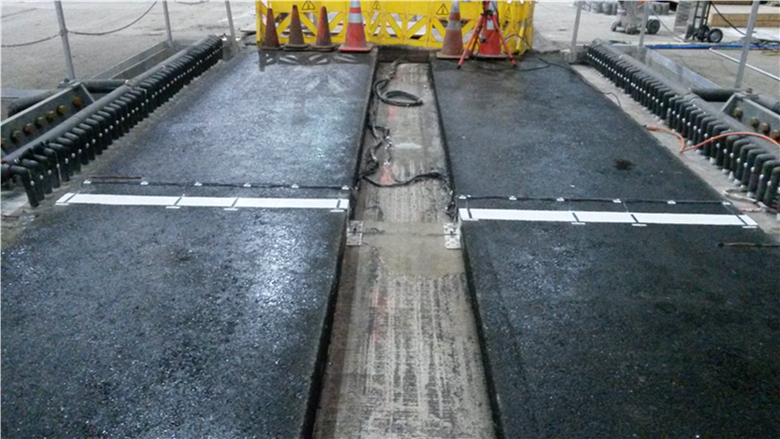
Phase IV was paved on December 18, 2014. Prior to overlay construction, the milled concrete slab surface was thoroughly washed to remove all dirt and dust. To prevent interface slippage and secondary cracks, a thin tack coat of straight PG 64-22 asphalt was applied on the dry surface of two 12-in.-thick, 15- by 15-ft concrete slabs. To facilitate instrumentation, the north overlay was built in two 2.5-in. lifts and the south side contained two 2.5-in lifts at the bottom and one 2.0-in. lift on the top. The complete HMA overlay was 30- by 5-ft with a 2-ft gap in between.
The construction daily notes can be found here.
(Click to Zoom)
Instrumentation
Instrumentation took place in two phases: during construction and post-construction. During the overlay paving, H-type asphalt strain gages (EG) were installed at the bottom of each lift. Once the pavement temperature stabilized, surface strain gages (SG) were installed at the varies locations on the pavement surface and edges. Note that all sensors were directly above and perpendicular to the PCC joint. Thermocouples were embedded at three depths (surface, mid-depth, and bottom) in the overlay to acquire the temperature profile.
RC Phase IV Drawing
Testing Protocol
Temperature variations were approximated by a haversine waveform describing the relationship between the joint opening and cycle time:
where t is the time of interest, D is the amplitude of joint opening, T is the cycle time, and R is rest period, which was included at the end of each loading cycle to allow the HMA materials to relax. In Phase III testing, the joint opening (D) was set at 12 mils which corresponded to a large temperature drop (17oF) at the overlay bottom in the field. Each haversine loading cycle began with a loading time of 75 sec, once the actuators reached the maximum horizontal displacement (joint opening), a 75-sec unloading was executed and then followed by a rest period of 600 sec to allow the overlay to relax.
Test Results
Pre-test shake-down unintentionally damaged the 7-in. overlay on the south side. Therefore, the test data collected were limited to the 5-in. overlay on the north side only. Strain responses were used as the primary tool to determine crack initiation. In addition, a visual examination of the test pavement was conducted multiple times a day to identify cracks off the “best guess” crack path and trace the extension of existing cracks.
The testing daily notes can be found here.
Crack Propagation
Measured crack propagation rates is provided in Figure 1. In general, the reflection crack advanced as the crack propagation rate (CPR) increased, the crack progressed substantially divergent once it penetrated through the bottom lift of the overlay. To fracture the top 1.125-in overlay, a growth of 35% in CPR was required for the appearance of a reflection crack on the surface.
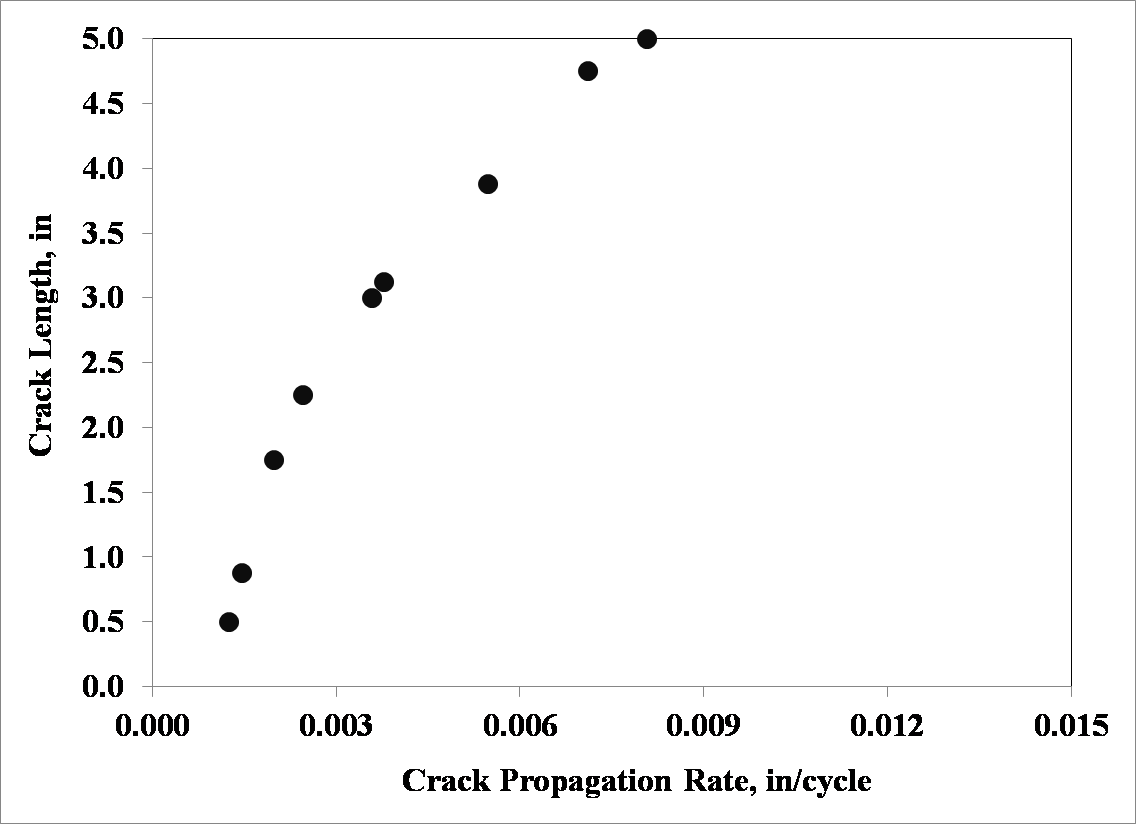
Figure 1. Crack Propagation (Click to Zoom)
Fatigue Life
As illustrated in Figure 2, the crack length developed gradually at the beginning, and its propagation rate became higher and higher with the crack growth. No noticeable fatigue life extension was observed when the crack length exceeded the 3.0-in benchmark. This is to say, increasing overlay thickness may not be an effective way to prolong the fatigue life (delay crack propagation) for the overlay structure and materials considered in Phase IV test.
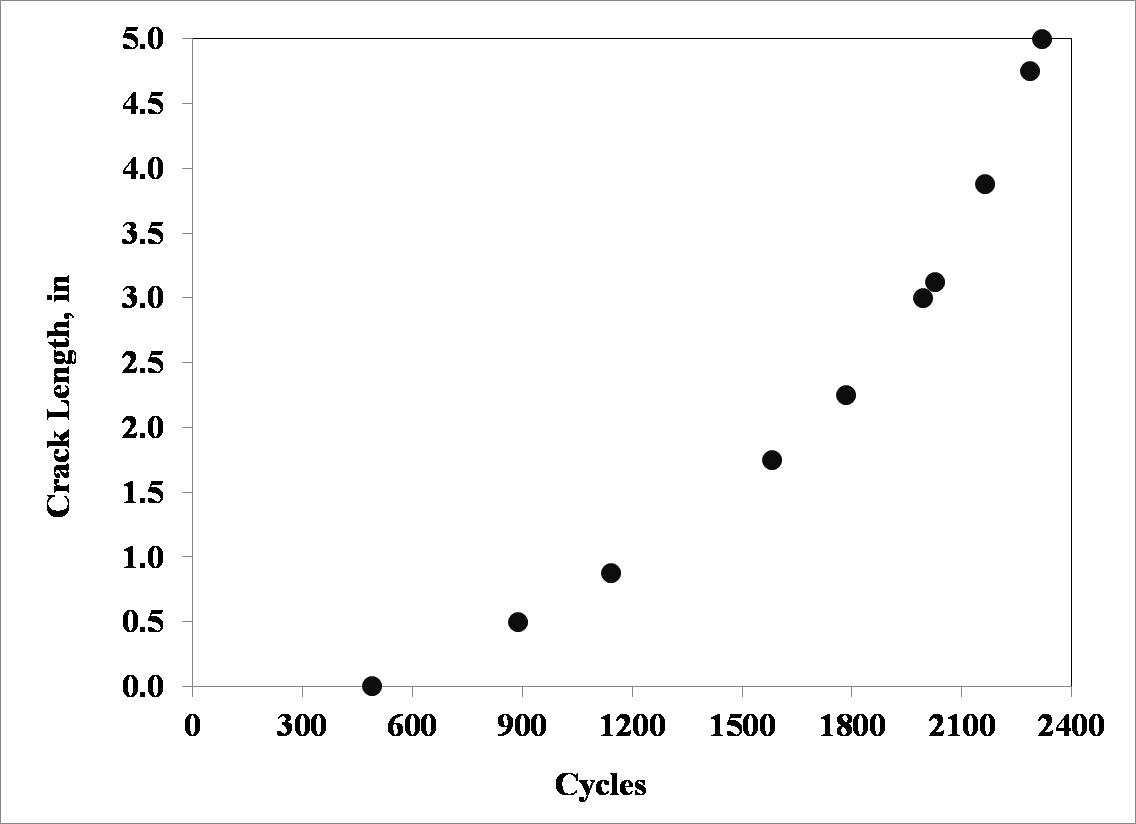
Figure 2. Fatigue Life (Click to Zoom)
Conclusions
Phase IV test was designed in support of the prediction model for HMA overlay fatigue life using full-scale test data. Full-scale test was conducted in a controlled displacement mode at a specific displacement rate with a fixed maximum joint opening. Field measurements suggested that increasing overlay thickness might not be an effective way to extend the fatigue life for the overlay structure and materials considered in the study. Phase V test results have shown that there are areas that need to be investigated to provide a better understanding of the effect of fracture healing on the reflection crack propagation. This includes the influence of rest periods between loading cycles, elevated pavement temperatures close to the surface, and their interaction with the crack propagation rate.
References
- Yin, H. (2016) “Prediction of Thermally-induced Reflective Cracking using Full-scale Test Data,” 8th RILEM International Conference on Mechanisms of Cracking and Debonding in Pavements.
- Yin, H. (2016) “Prediction of HMA Overlay Fatigue Life using Full-scale Test Data,” 95th TRB Annual Meeting, Washington D.C.
- Yin, H. (2017) Reflective Cracking Phase IV Test Report.
Return to Reflective Cracking Overview