ProGroove
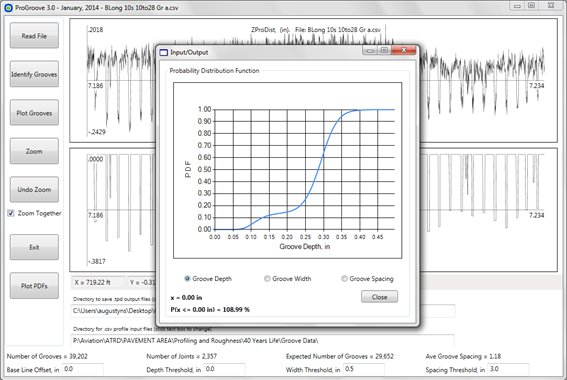
ProGroove Interface (Click to Zoom)
ProGroove is a software developed by the FAA that uses laser scan data of pavements to identify grooves and output statistics about the grooves. Laser scan data is gathered from inertial profilers and other devices.
ProGroove accepts a .CSV file, which has a simple format where numbers are listed in a single column. The first number is the sample spacing in feet, and all following numbers describe the groove profile in inches. An example file is shown below.
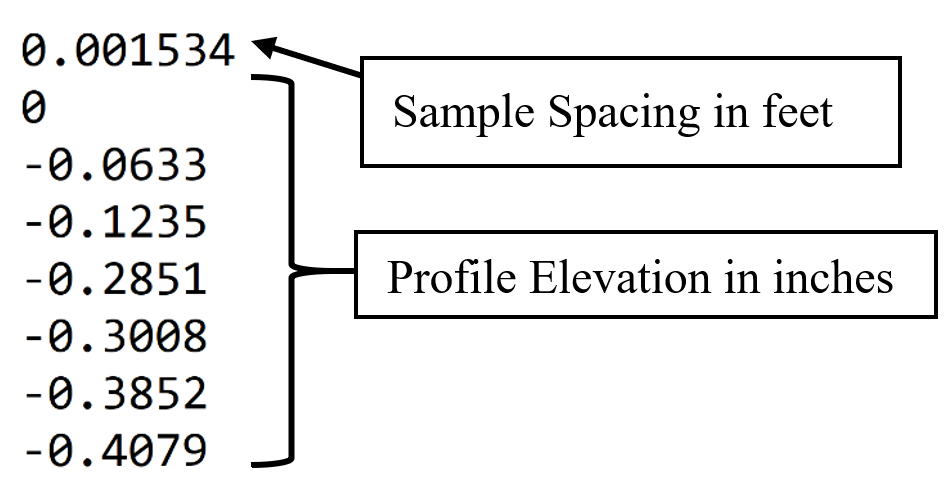
ProGroove .CSV input File Format (Click to Zoom)
There are three main parameters in ProGroove: the Depth Threshold, the Width Threshold, and the Spacing Threshold. The Depth Threshold is the maximum depth at which ProGroove will consider an identified item as a groove. If the joint or groove identified has a depth greater than the Depth Threshold, it will be identified as a joint, and not a groove. The Width Threshold is the maximum width at which an identified item will be identified as a groove. If the joint or groove identified has a width greater than the Width Threshold, it will be identified as a joint, and not a groove. For an identified item to be identified as a groove, its width must be less than the Width Threshold, and its depth must be less than the Depth Threshold. The Spacing Threshold is the maximum expected distance between grooves, and should be chosen to be greater than the expected groove spacing. A visual explanation of the three parameters is shown in the figure below.
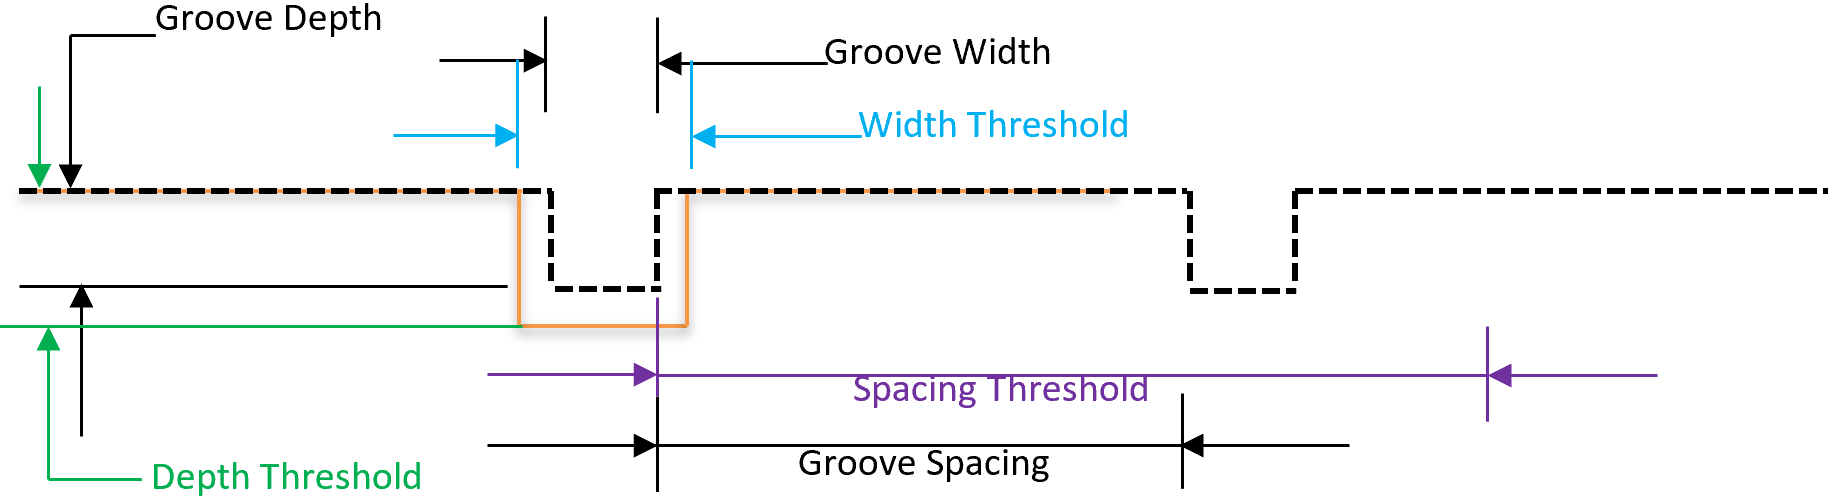
Illustration of ProGroove Thresholds (Click to Zoom)
Once all parameters are input, “Identify Grooves” can be selected. ProGroove will then identify grooves in the profile and calculate the groove depth, width, and display the number of identified grooves, the number of identified joints, the expected number of grooves, and the average groove spacing. ProGroove’s expected number of grooves assumes that the runway is made of concrete, has joints, and has a regular groove spacing. Three plots are also displayed showing the groove depth and the groove width, as shown below.
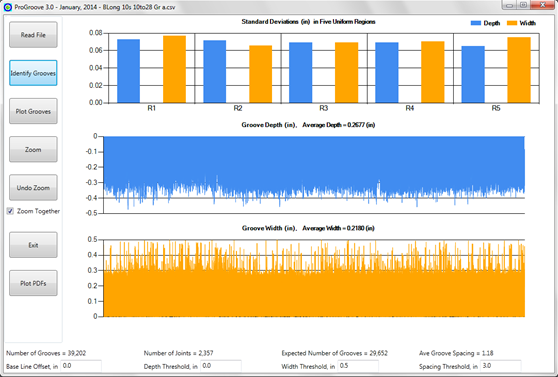
ProGroove Groove Depth and Width Results (Click to Zoom)
ProGroove TPD Output File Table Columns with Explanations
|
Column Title
|
Statistic, Metric, or Explanation
|
Units
|
|
Section No.
|
Section Number
|
Distance in Units of Section Length
|
|
Expected Grvs
|
Expected grooves (The expected number of grooves assumes that the runway is made of concrete.)
|
Count
|
|
Ident. Grvs
|
Identified grooves
|
Count
|
|
Ave. Depth, in
|
Average groove depth
|
Inches
|
|
Sigma Depth, in
|
Standard deviation of groove depth
|
Inches
|
|
Ave. Width, in
|
Average groove width
|
Inches
|
|
Sigma Width
|
Standard deviation of groove width
|
Inches
|
|
Ave. Space, in
|
Average groove spacing
|
Inches
|
|
Sigma Space
|
Standard deviation of groove spacing
|
Inches
|
|
Ave. Area, sq in
|
Average groove cross section area
|
Square inches
|
|
Sigma Area
|
Standard deviation of groove cross sectional area
|
Square inches
|
|
Ident/Expected
|
Percentage of grooves identified
|
Percentage
|
|
%D ≤ 1/8 in
|
Percentage of identified grooves with a depth less than 1/8 an inch
|
Percentage
|
|
%W ≤ 1/8 in
|
Percentage of identified grooves with a width less than 1/8 an inch
|
Percentage
|
|
No. Grvs Spc ≤ 2.0 in
|
Number of grooves with a spacing less than or equal to 2 inches
|
Count
|
|
No. Grvs Spc 2.0 to 12.0 in
|
Number of grooves spaced between 2 to 12 inches apart
|
Count
|
|
No. Grvs Spc > 12.0 in
|
Number of grooves spaced more than 12 inches apart.
|
Count
|
The .TPD file lists these statistics by section number, and also contains a total row. This row summarizes each statistic for the whole runway.
ProGroove can also be used to generate probability distribution function (PDF) plots. These can be viewed by clicking “Plot PDFs” in ProGroove. A screenshot of the PDF plot can be seen in the figure below.
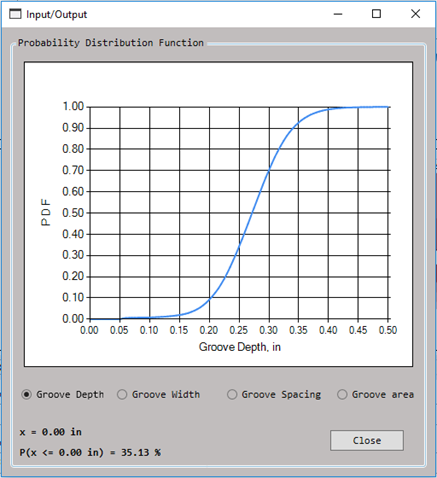
Probability Density Function Plot Generated by ProGroove (Click to Zoom)
Return to NDT Technology Overview