Reflective Cracking Phase VI
Phase VI Test Summary
Reflective Cracking Indoor Phase -VI (RCIP-VI) full-scale tests started on June 7, 2019. After 6426 loading cycles, RCIP-VI test concluded on August 5, 2019.
Objective
The primary objective of Reflective Cracking Indoor Phase-VI (RCIP-VI) test was to assess the effect of extreme cooling cycles on the crack evolution through varied displacement rates. Secondly, it was expected to obtain the model parameters of Paris and Erdogan Law from full-scale test data to support the parallel modeling effort on the crack propagation.
Overlay Design
Phase VI test overlay included two strips of 5-in thickness that were 30- by 5-ft with a 2 ft space in between. The materials were constructed in accordance with the Federal Aviation Administration (FAA) standard P-401 HMA (PG 64-22).
Construction
RCIP-VI was paved on April 30, 2019. Prior to the overlay construction, milled concrete slab surface was thoroughly swept to remove all loose dirt and debris. To prevent interface slippage and secondary cracks, a thin tack coat of straight PG 64-22 binder was applied to the dry surface of two 12-in.-thick, 15- by 15-ft concrete slabs (Figure 1). To facilitate instrumentation, the overlay was built in two 2.5-in lifts. After placing each lift, the HMA materials were thoroughly and uniformly compacted by a power roller without vibration due to the sensors underneath. The density atop each lift was measured using Nuclear Densometer.
The construction daily notes can be found here.
An overview of the Reflective Cracking Phase VI can be seen below. For a pdf version of the Reflective Cracking Phase VI As-Built Drawings, click here.
.PNG?ver=2019-12-05-100137-507)
Reflective Cracking Phase VI Plan View (Click to Zoom)
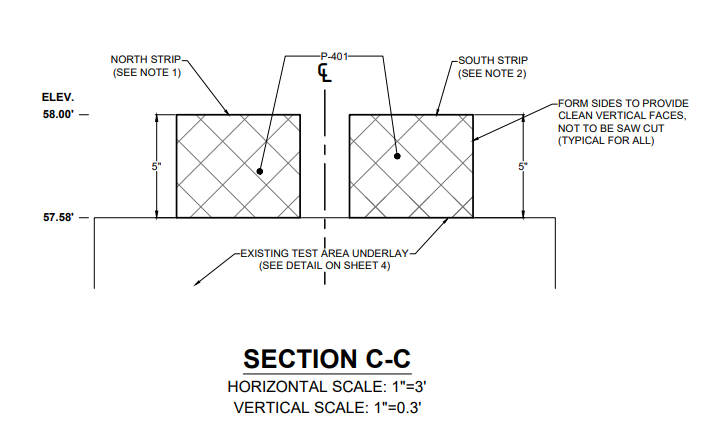
Reflective Cracking Phase VI Profile View (Click to Zoom)
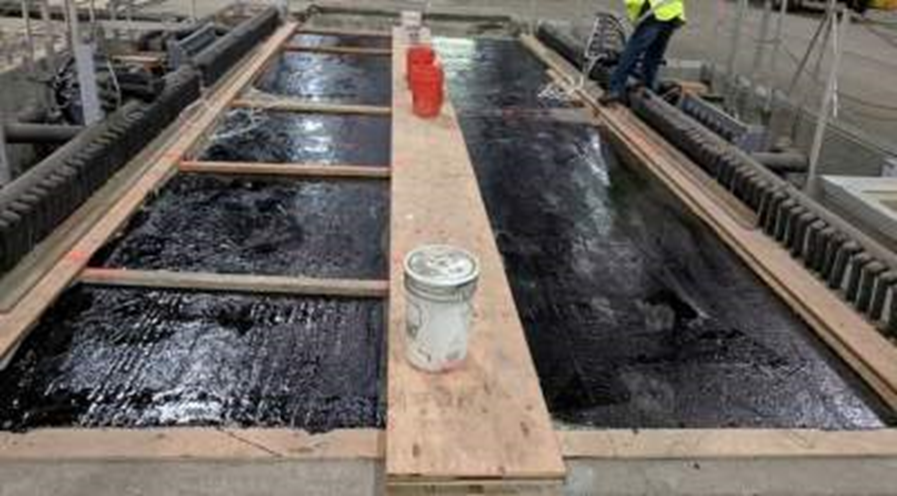
Figure 1. Thin Tack Coat of Straight PG 64-22 on Top of Concrete Slab (Click to Zoom)
Instrumentation
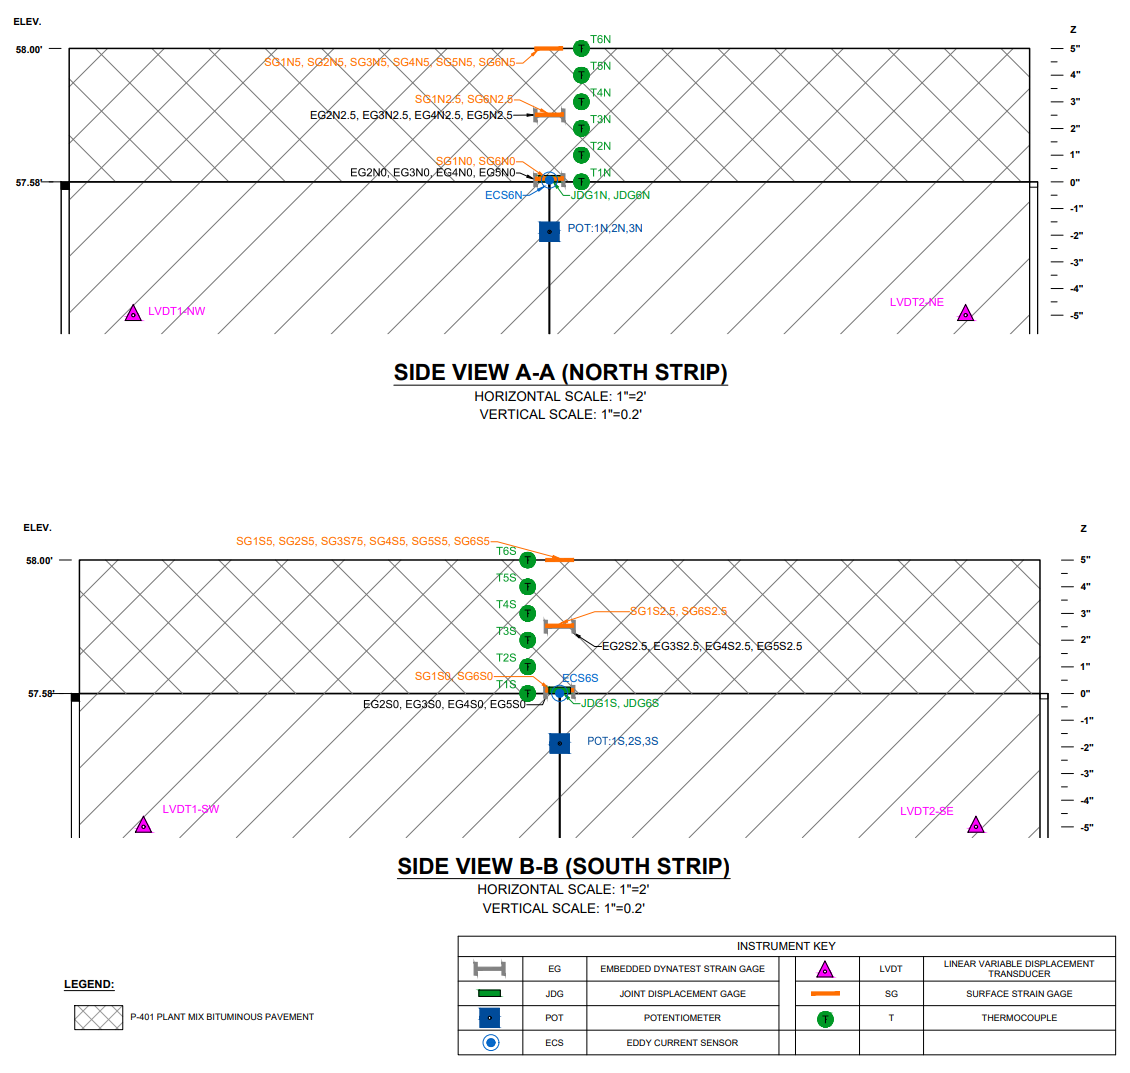
Instrumentation took place in three stages: pre-construction, during construction, and post-construction. Prior to the overlay construction, potentiometers (POT), linear variable differential transformers (LVDT), and joint displacement gages (JDG) were connected and secured. During the overlay paving, H-type embedded asphalt strain gages (EG) were installed at the bottom of each overlay lift (2.5 in.) (Figure 2). After the paving, surface strain gages (SG) were installed at various locations on the surface. Two thermocouple trees were installed in the overlay and each tree contained multiple thermocouples (T) to measure the temperature at the same depth as the strain gages.
Reflective Cracking Phase VI Instrumentation Plan View (Click to Zoom)
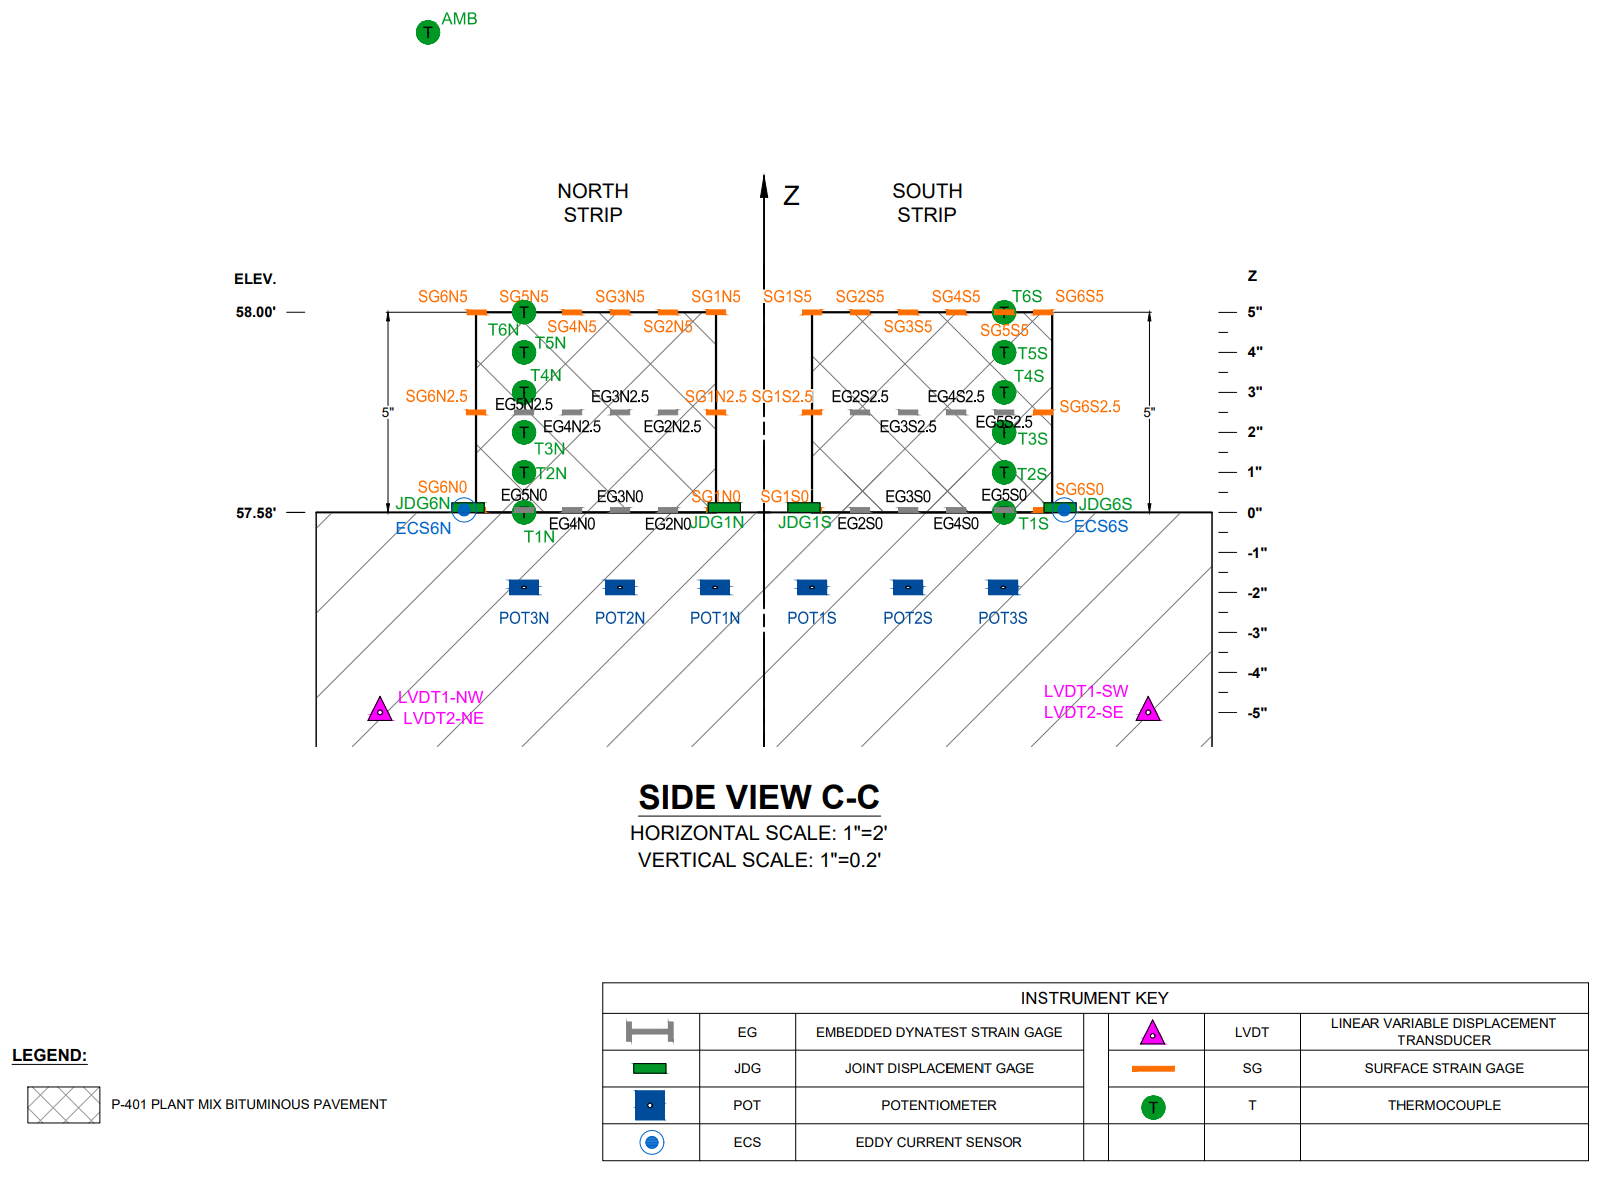
Reflective Cracking Phase VI Instrumentation Profile View (Click to Zoom)
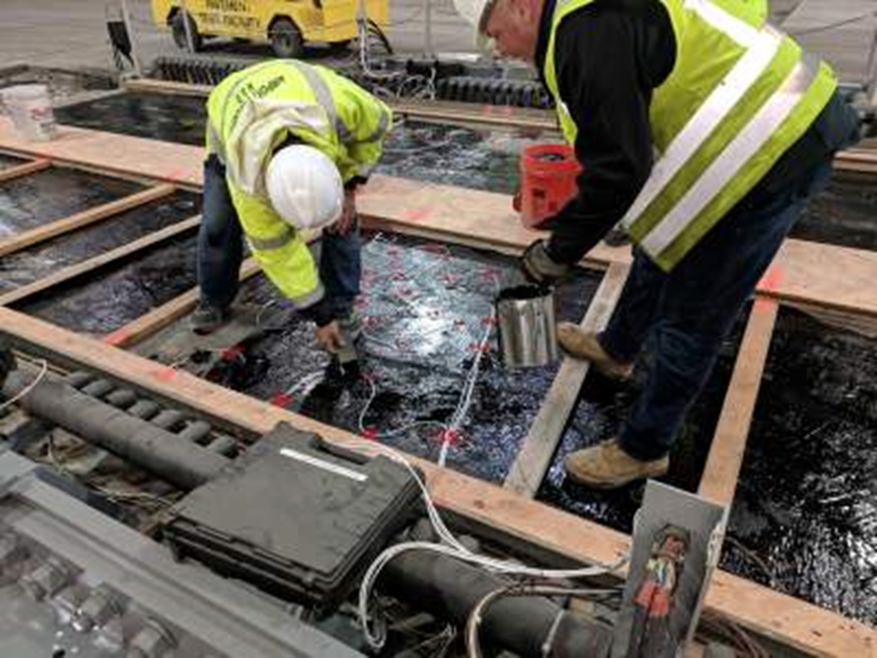
Figure 2. EG Installation (Click to Zoom)
Testing Protocol
Temperature variations were approximated by a haversine waveform describing the relationship between the joint opening, d(t), and cycle time:
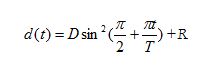
where t is the time, D is the amplitude of joint opening, T is the cycle time, and R is the rest period at the end of each loading cycle. The 360-day temperature variations with extreme cool cycles were simulated in two steps. For the first 330 loading cycles, each cycle began with a loading time of 75 sec, once the actuators (north and south) reached the maximum horizontal displacement (joint opening) of 12 mil, a 75 sec unloading was executed, followed by a rest period of 600 sec to allow the overlay to relax. Then, a different test recipe was executed for the next 30 loading cycles with the same maximum displacement (12 mil). Loading time, unloading time and rest period were shortened by half.
Test Results
The testing daily notes can be found here.
Observations
Reflection cracks initiated from the overlay bottom and propagated to the surface. Bottom-up cracks were first observed on the outer edge of the north section followed by the inner edge. Similar observations were obtained from the south section but after more loading cycles. Directly above the underlying PCC joint, continuous transverse reflection cracks were observed on the overlay surface. Distress survey was conducted multiple times a day. All identified cracks were outlined with chalk when needed and measured using a tape measure. Any change to the existing crack was recorded along with any new cracks. Figure 3 provides a sample of the distress map.
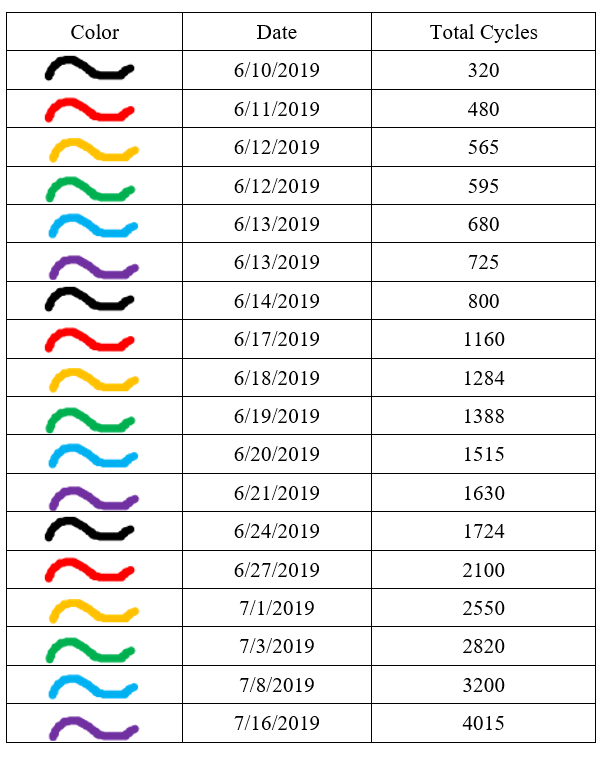
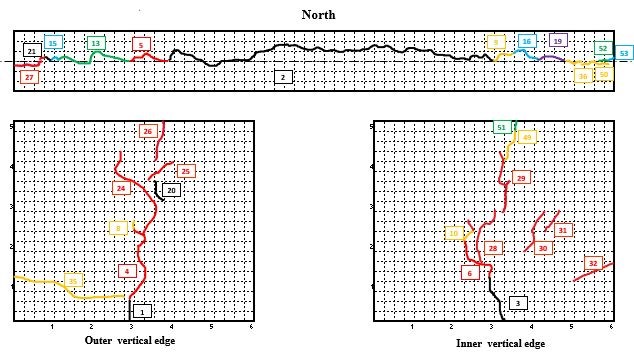
(a) North
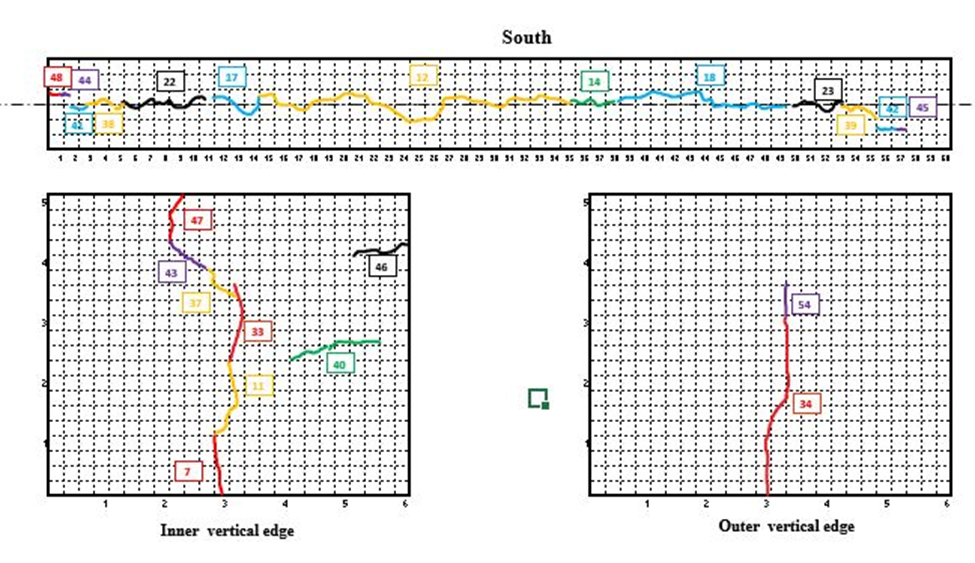
(b) South
Figure 3. Distress Survey Crack Map (Click to Zoom)
Damage Analysis
Crack evolution is a multi-scale phenomenon. Cracks develop as micro-cracks at points of stress concentration which coalesce to form macro-cracks. Reflective cracking in AC overlay is driven by crack nucleation, initiation and propagation. Crack nucleation and crack initiation occurs at a much smaller scale compared to crack propagation. Damage analysis therefore needs to be conducted on both micro and macro scale (Figure 4). At micro-scale, failure strain was selected as the damage parameter for crack initiation because it represents localized damage occurring in the vicinity. At macro-scale, strain energy and fracture energy were deemed as the most appropriate parameters.
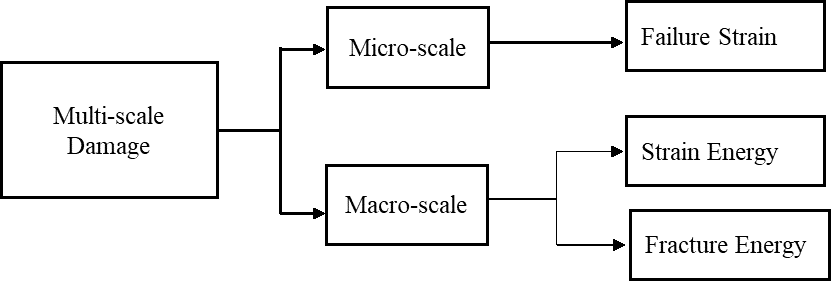
Figure 4. Flow Chart of Damage Analysis (Click to Zoom)
Failure Strain
Strain responses were tensile in nature and increased with the overlay depth. The highest tensile strains were observed at the bottom outer edges, indicating the initial occurrence of reflection cracks. Strong dependency of failure strains on the overlay depth was observed from RCIP-VI test data, as shown in Figure 5. Failure strain decreased in magnitude with crack propagation towards the overlay surface. Average failure strain of north and south sections at the bottom, mid-depth and surface of the overlay was 1215, 890, and 560 microstrains, respectively.
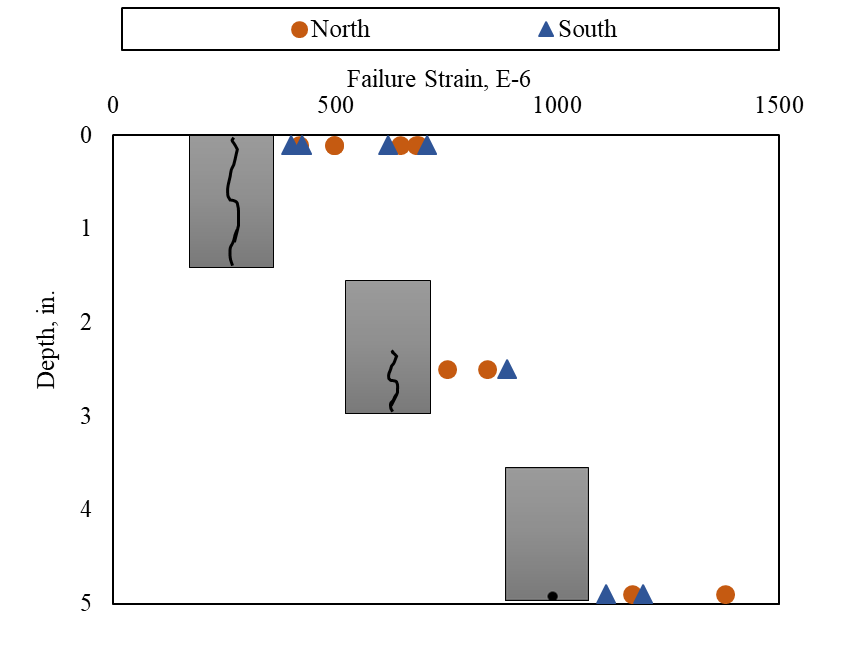
Figure 5. Failure Strain vs. Depth (Click to Zoom)
Strain Energy
Strain Energy is defined as elastic energy stored in the body under loading. From the basic principles of work and energy, strain energy density (U′) is defined as:
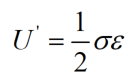
where σ is the stress and ε is the strain. Internal Strain Energy per unit area in the undamaged system (UUndamaged) can be defined as:
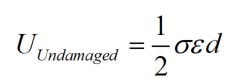
where d is the depth of an undamaged overlay system with zero crack length. Considering unit area, internal Strain Energy associated with a damaged system is defined as follows:
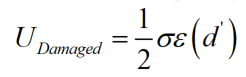
where d is the effective depth. Internal Strain Energy is reduced as a result of crack propagation. Figure 6 demonstrates UUndamaged and UDamaged. Strain Energy at crack initiation was defined as Critical Strain Energy.
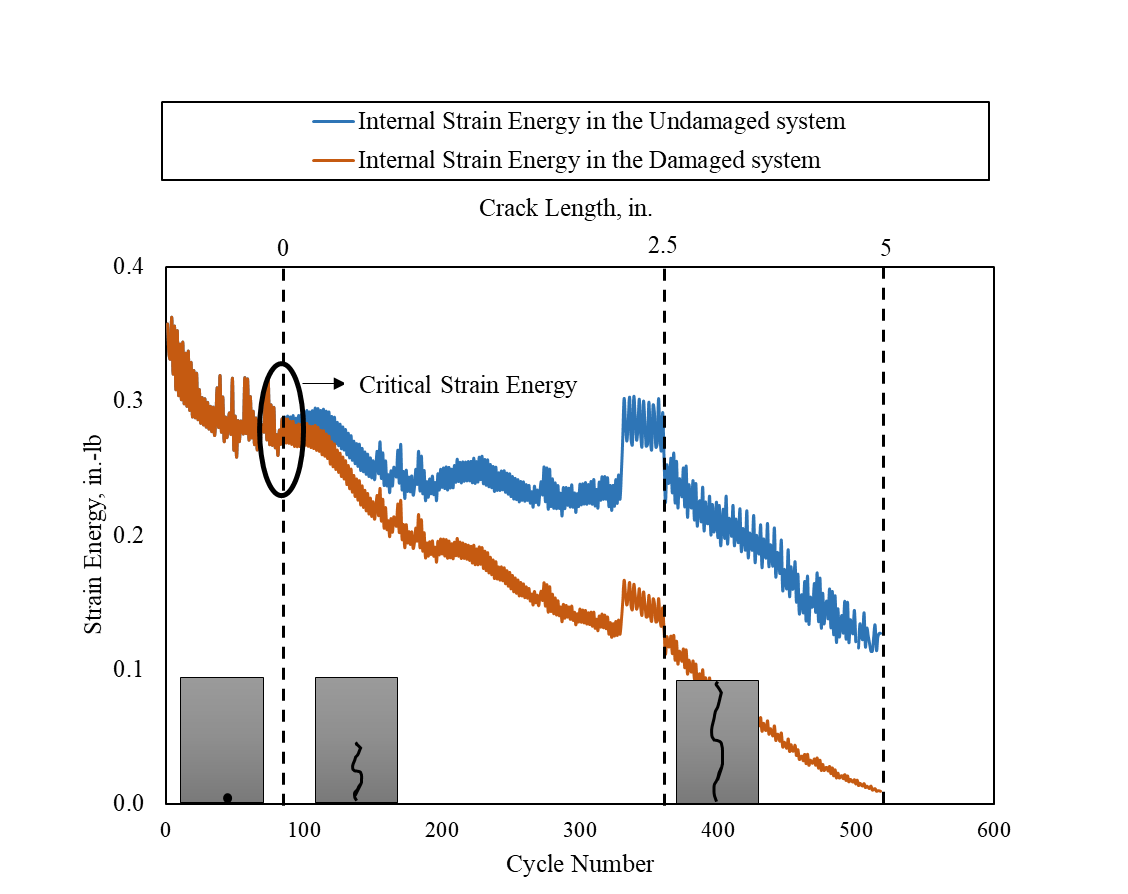
Figure 6. Strain Energy (Click to Zoom)
Fracture Energy
Fracture Energy (G) is defined as the area under the loading regime on the load vs. displacement curve. To separate two phases of crack formation, initiation and propagation, Equation 11 of RCIP-IV Comprehensive Report was adopted to determine the number of cycles for crack initiation Fracture Energy of each loading cycle in the crack initiation stage (Cycle 1 to Cycle 192) and propagation stage (Cycle 193 to Cycle 2700) is provided in Figure 7. Fracture Energy at crack initiation was defined as Critical Fracture Energy.
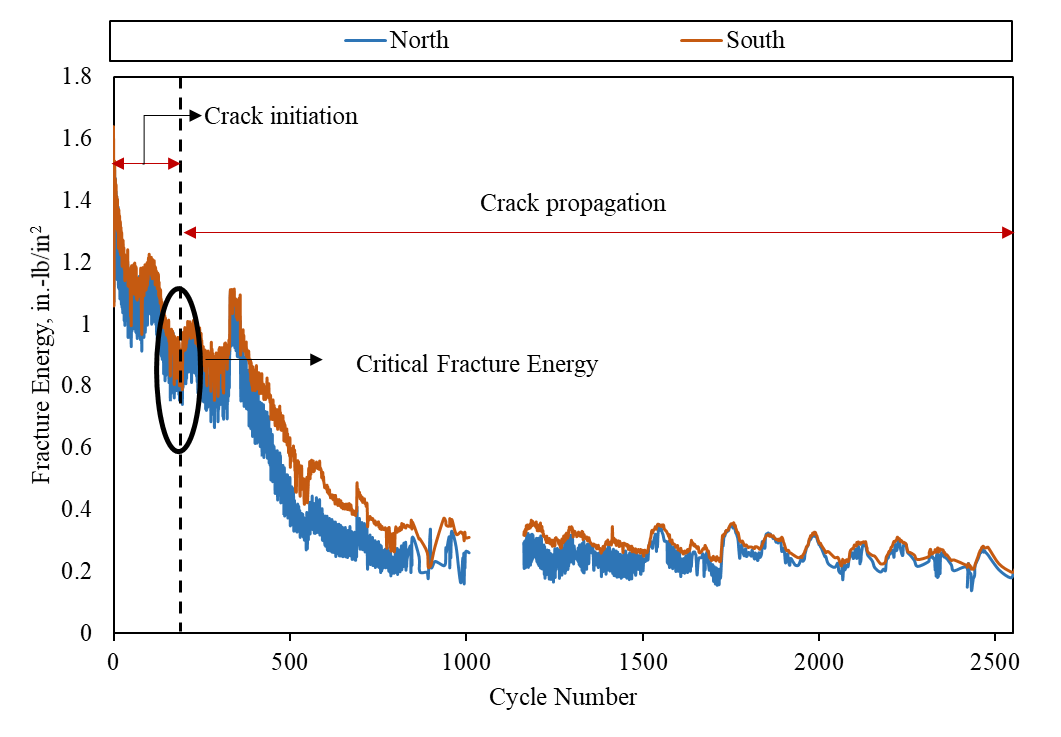
Figure 7. Fracture Energy (Click to Zoom)
Crack Propagation Analysis
For RCIP-VI test data, a modified Paris and Erdogan Law was proposed as functions of Strain Energy Release (ΔU) and Fracture Energy Release (ΔG):
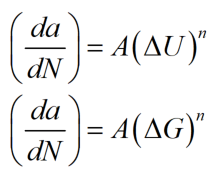
Material parameters A and n were then determined through regression analysis on the average crack propagation rate values of north and south section. Material constants A and n, for the modified Paris and Erdogan Law based on ΔU are 0.0326 and 0.3821, whereas based on ΔG are 0.008 and 0.4213, respectively.
Effect of Extreme Cooling cycle
Figure 8 and Figure 9 illustrates two quantities defined as follows:
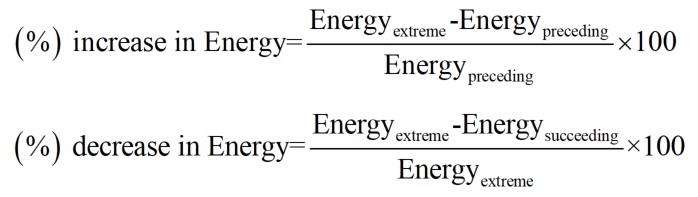
where Energyextreme is the average of UDamaged(or G) during 30 extreme cooling cycles, Energypreceeding is the average of UDamaged(or G ) during the preceding 30 loading cycles and Energysucceeding is the average of UDamaged(or G ) during the succeeding 30 loading cycles. Figure 8 and Figure 9 reveals a higher energy release due to extreme cooling cycles and resulted in more damage because (%) decrease in UDamaged was higher compared to (%) increase.
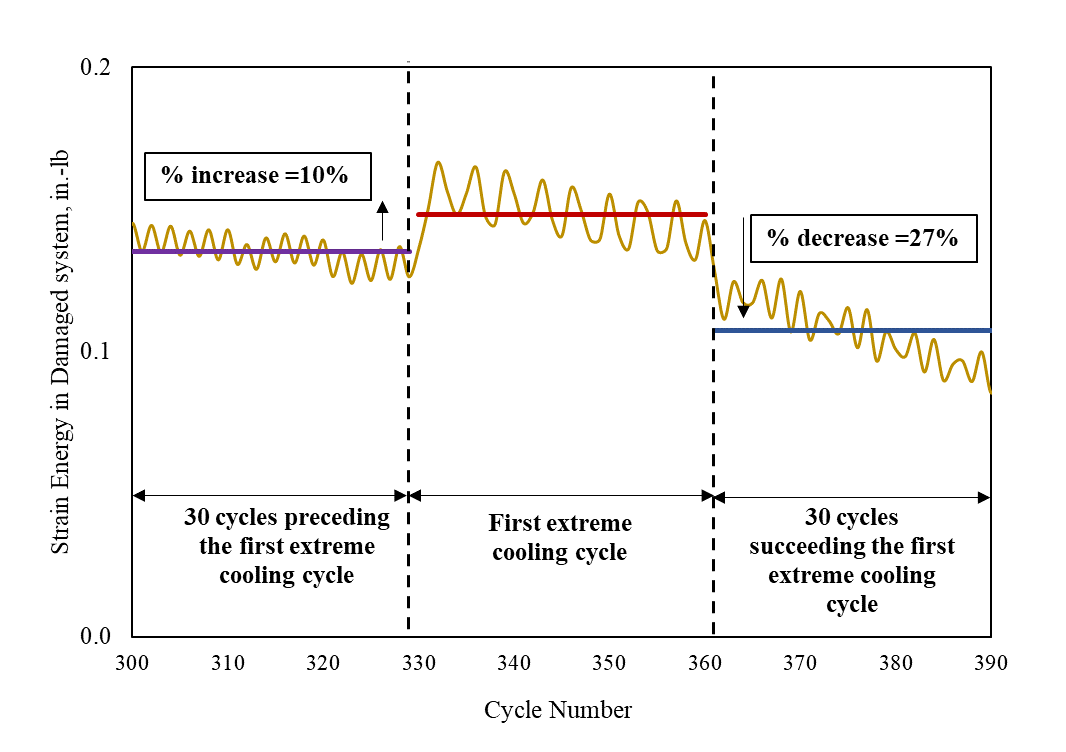
Figure 8. Strain Energy Preceding, During, and Succeeding the 1st set of Extreme Cooling Cycles (Click to Zoom)
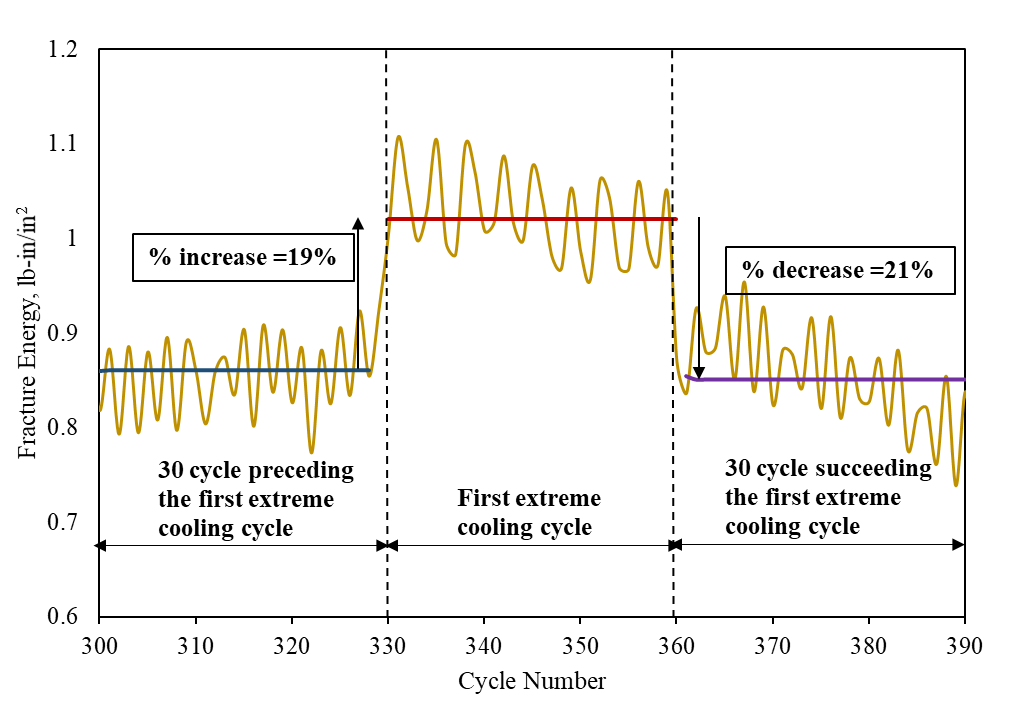
Figure 9. Fracture Energy Preceding, During, and Succeeding Extreme Cooling Cycles (Click to Zoom)
Lab Material Characterization
Aside from full-scale testing, various laboratory tests were performed on the field cored HMA samples for advanced material characterization. The laboratory testing program includes dynamic modulus test, Texas Overlay test and customized overlay test. Dynamic modulus test results will be used to obtain the viscoelastic properties of the HMA mixture. Texas overlay test will be used to assess the compaction effort on the fracture performance of the HMA mixture. Customized overlay test will be used to evaluate the effect of extreme cooling cycles on the crack initiation and propagation. And finally, the laboratory test results will be used to establish correlations between the laboratory and indoor full-scale test. The complete laboratory testing program for Phase 6 is presented in Table 1.
Table 1: Reflective Cracking Indoor Phase-6 Laboratory Testing Program
|
Test
|
Standard
|
Properties / Parameter
|
|
Dynamic Modulus
|
AASHTO T-342
|
Dynamic Modulus Master Curves
|
|
Texas Overlay
|
Tex 248-F
|
Fracture Energy (Gc), Fatigue Parameters (LRR, CRI)
|
|
Customized Overlay
|
Yin & Mandal (2017)[1]
|
Fracture Parameters (Gc, LRR, CRI), Fatigue Parameters
(Nf), Strain Parameters (Initial Strain, Failure Strain, Cycles at Failure, Strain at Nf)
|
Note: Gc = Critical Fracture Energy; LRR = Load Reduction Rate (%); CRI = Cracking Resistance Index; Nf = Number of Cycles at Failure Point;
Conclusions from TESS Testing
RCIP-VI test overlay consisted of two sections built with identical AC materials, the standard FAA P-401 HMA (PG 64-22), and equal thickness of 5 in. To evaluate the effect of extreme cooling cycle on the crack initiation and propagation, two distinct displacement rates were simulated by the TESS. General test observations such as crack sequencing, failure strain, and crack evolution agreed well to the previous experiments. Analysis results of RCIP-VI test data included the following:
- Effect of extreme cooling cycles was prominent on the strain gage responses.
- Effect of extreme cooling cycle was identified and quantified through Strain Energy and Fracture Energy analysis. Both demonstrated the energy release during the crack propagation and associated overlay weakening.
- To characterize the crack propagation, the Paris and Erdogan Law was first modified using Strain Energy Release and Fracture Energy Release. Then material properties, A and n, were derived.
References
[1] H. Yin and T. Mandal, “Reflective Cracking Phase IV Comprehensive Report b - Material Characterization,” U.S. Department of Transportation, Washington D.C., USA, FHWA-JPO-XXXX, Oct. 2017.
Return to Reflective Cracking Overview