Traffic Testing Results and Analysis
Temperature Analysis
The figure below shows the temperature data at the top, middle, and bottom of HMA overlay on the TO section. During daytime, temperature increased until mid-afternoon (within 2:00 PM – 3:00 PM), followed by a gradual drop until the next morning. Throughout the 5-day trafficking, the lowest overlay temperature was always at the surface.
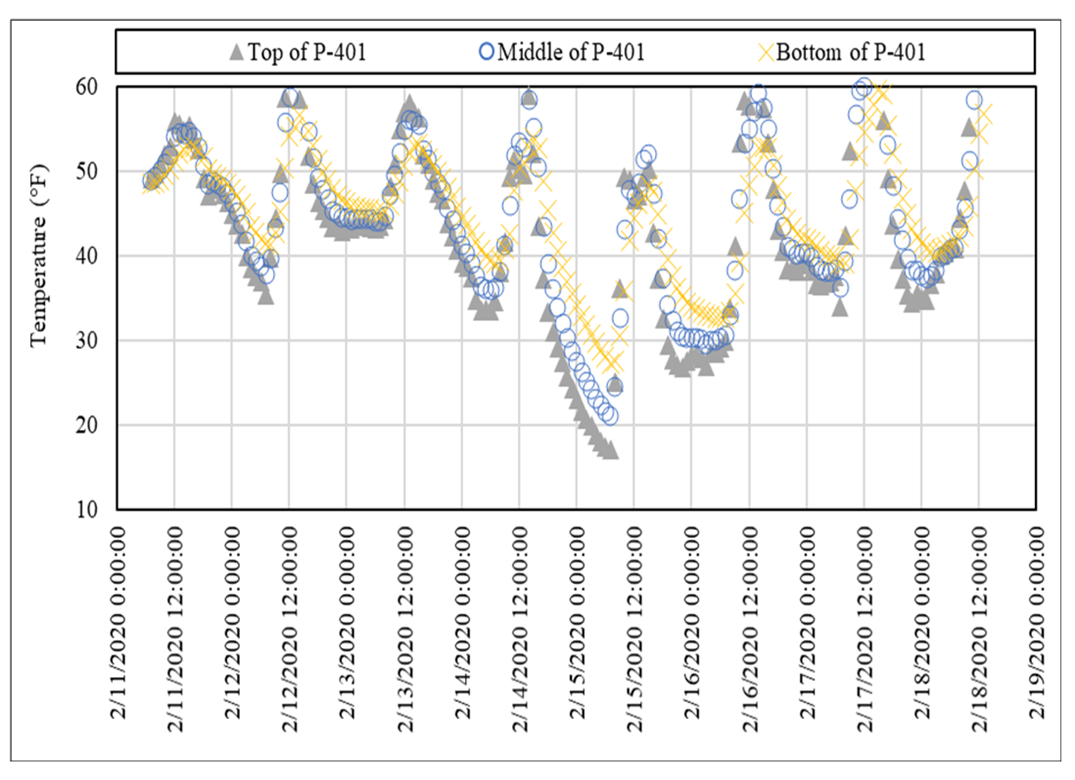
Temperature Variations in HMA Overlay (5 day of Trafficking) (Click Image to Zoom)
This observation is opposite to the temperature gradient from Reflective Cracking Indoor Tests where the bottom-up cooling scheme resulted in the lowest temperatures at the overlay bottom. One of such examples from Indoor Phase V Test is given in the following figure:.
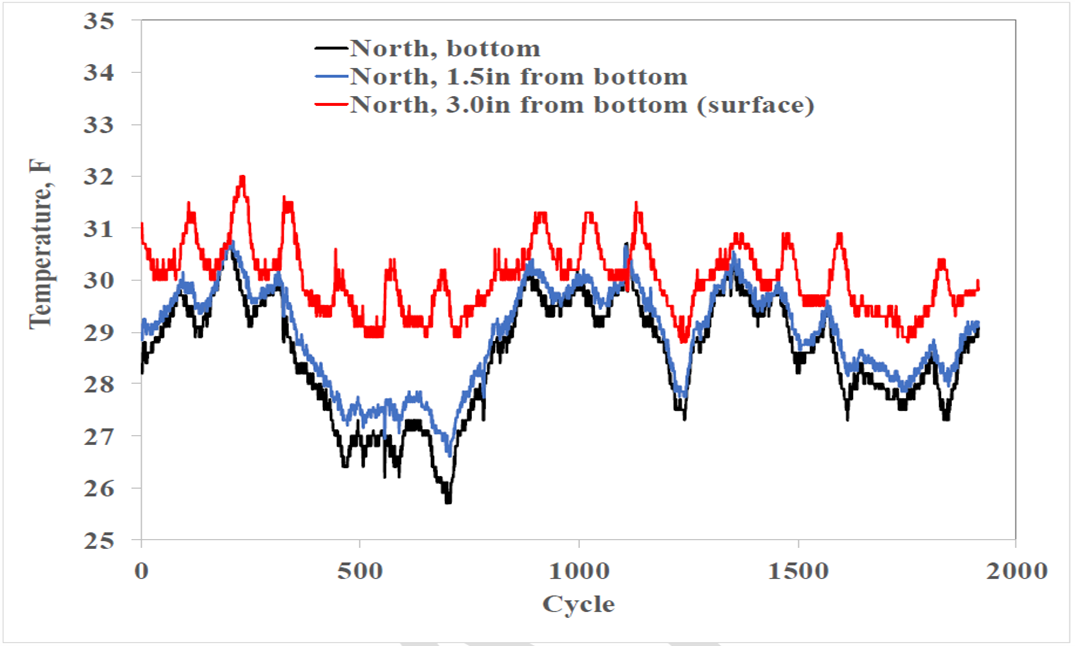
Temperature Variation in HMA Overlay (from RC Indoor Phase V)
Sensor Analysis
Crack Characterization
On February 12, 2020 (2nd day of trafficking), the first bottom-up crack was observed on the west vertical edge of joint TT45 (undoweled joint) after cumulative pass #496 as presented in the picture below.
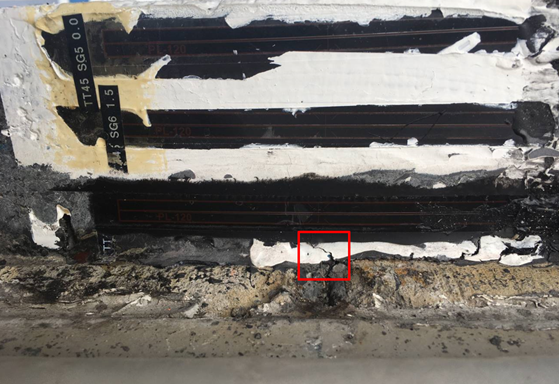
1st Bottom-up Crack on the West Edge of TT45 (February 12, 2020) (Click Image to Zoom)
The figure below shows some strain fluctuation from the bottom SG first manifested at cumulative pass #507, while strains from the upper two SGs remained stable.
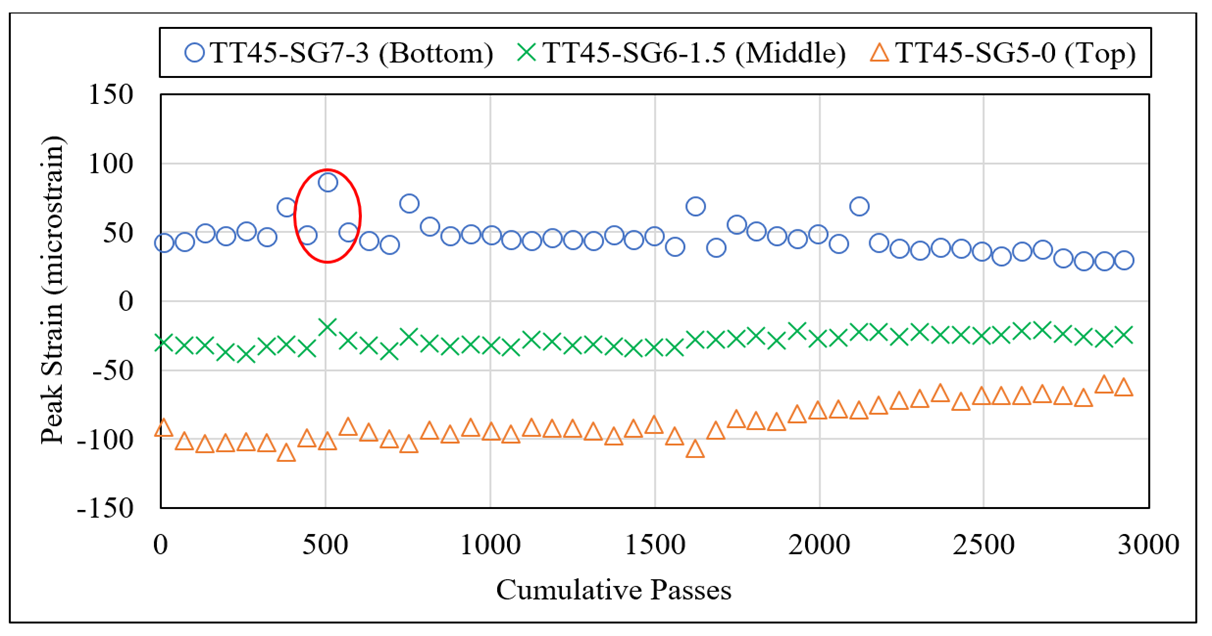
SG Response over Pass Number at the West Edge of TT45 (Click Image to Zoom)
Crosscheck of joint displacement readings from TT45-JDG2-5 identified the initial jump at the same pass number (see figure below). Therefore, the pass number corresponding to the crack initiation at this location was determined to be 507.
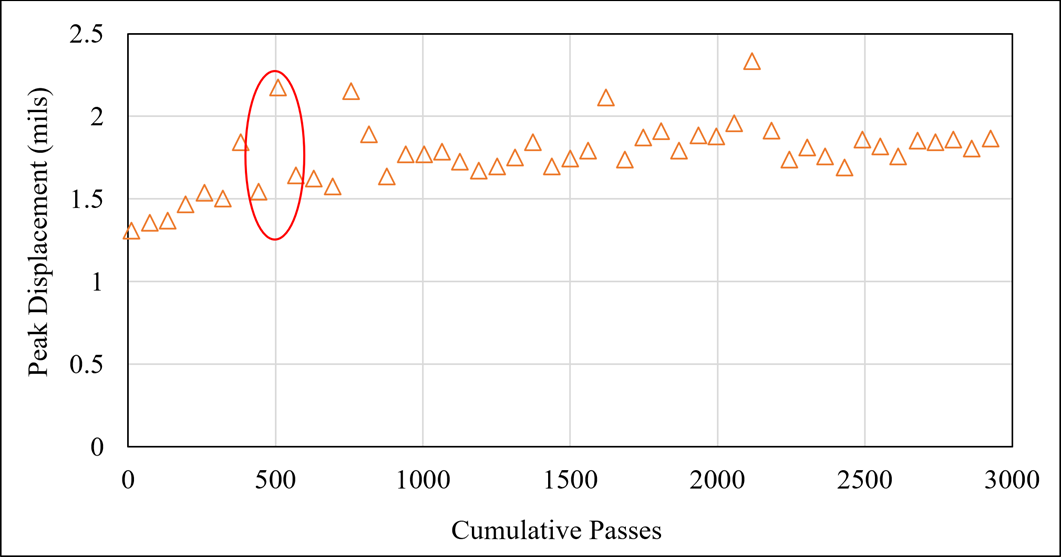
Joint Displacement at the West Edge of TT45 (Click Image to Zoom)
Following the analysis of Indoor Phase VI Test data, cumulative strain energy was calculated using the tensile strains from TT45-SG7-3.0. There was an apparent upshift in the trend of cumulative strain energy at pass #507 as shown in the figure below. This observation further confirmed the timestamp of the bottom-up crack initiation.
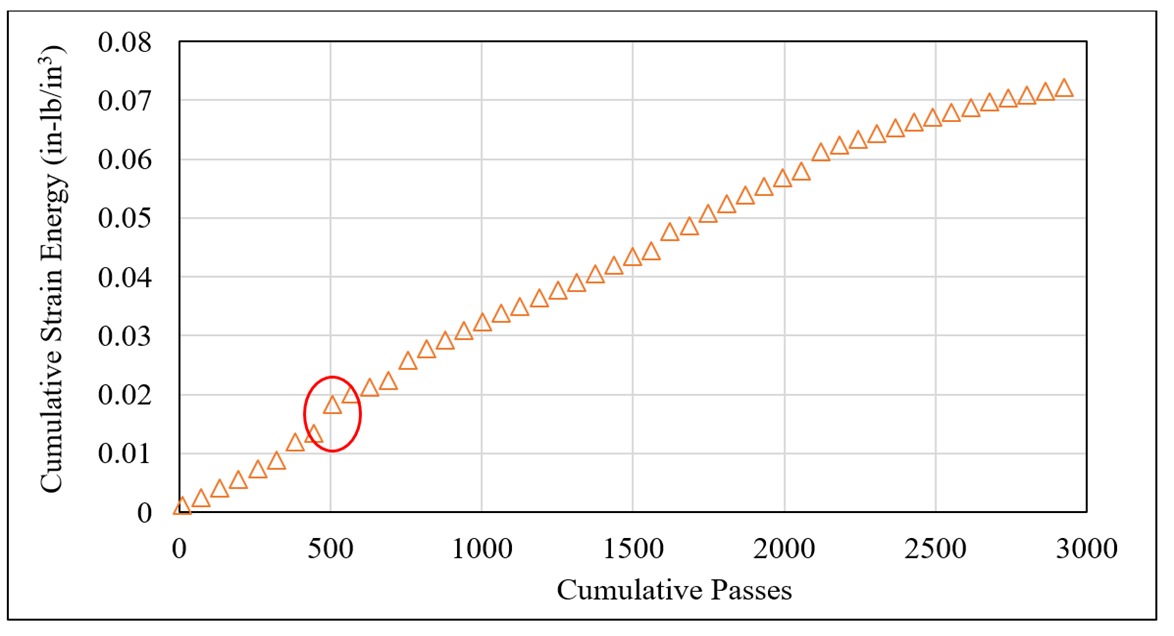
Cumulative Strain Energy Calculated from TT45-SG7-3.0 along West Edge of TT45 (Click Image to Zoom)
Joint Movement
During the traffic test, the TT section experienced a mixed loading of both traffic load using SWL and temperature variation. Hence, one doweled joint (TO12) and one undoweled joint (TO23) from the TO section were selected to study the temperature induced joint movement. As expected, the following figures show that the joint displacements at the doweled joint were smaller than the undoweled joint displacements.
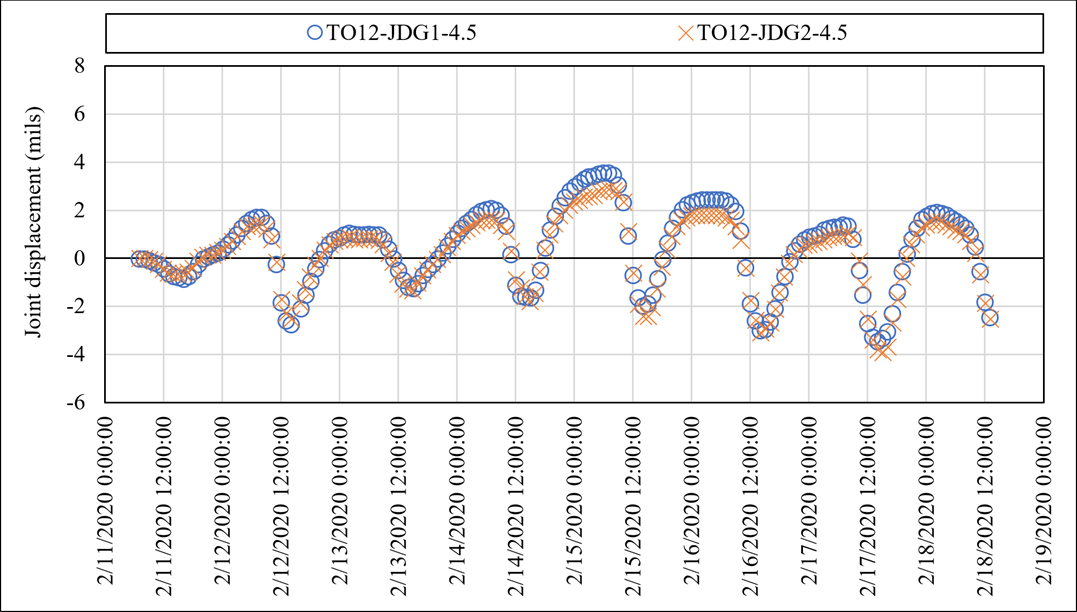
Joint Displacement along Doweled Joint (over 5-days of Trafficking) (Click Image to Zoom)
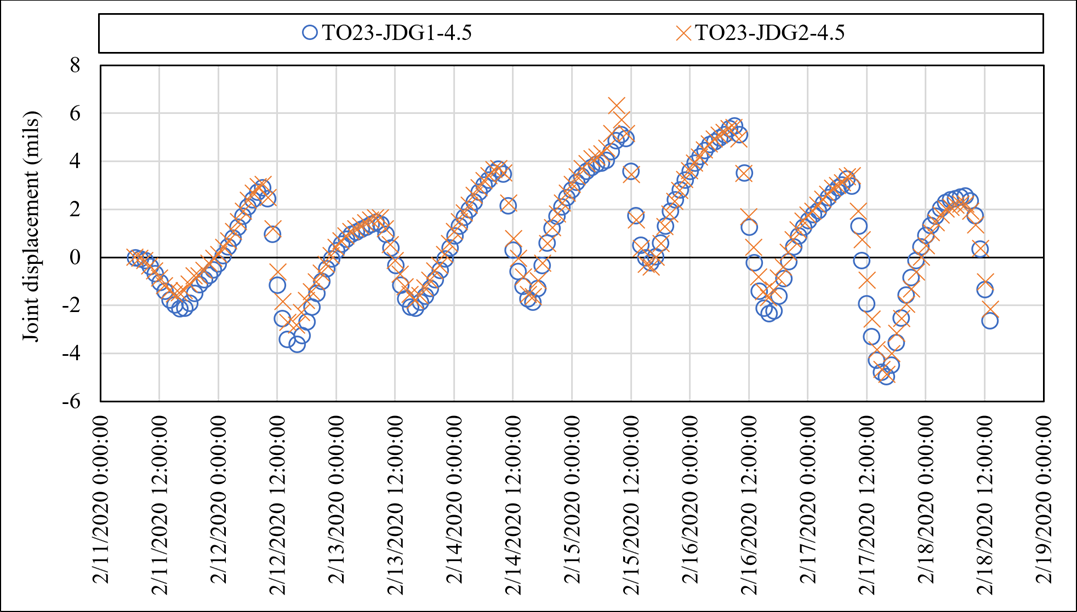
Joint Displacement along Undoweled Joint (over 5-days of Trafficking) (Click Image to Zoom)
An effort was made to correlate pavement temperature and joint opening/closing. During trafficking, the temperature variation in concrete (P-501MR), as captured by the thermocouple embedded at the mid-depth of PCC slabs, was very small (< 4°F). On the other hand, the range of temperatures in asphalt (P-401MR) layer was larger (> 15°F) due to the exposed overlay edges and the differential of thermal coefficient of contraction and expansion (CTC/E). The following figure shows the joint displacement against the temperature change at the bottom of the overlay for both doweled (TO12) and undoweled (TO23) joints. In linear fashion, the PCC joint opened whenever the overlay temperature decreased and vice versa. Regardless of the joint type, the joint opening/closing was governed by both the slab contraction/expansion and the resistance from the overlay material. Thus, the bottom of the overlay underwent temperature-induced tensile stress cycles.
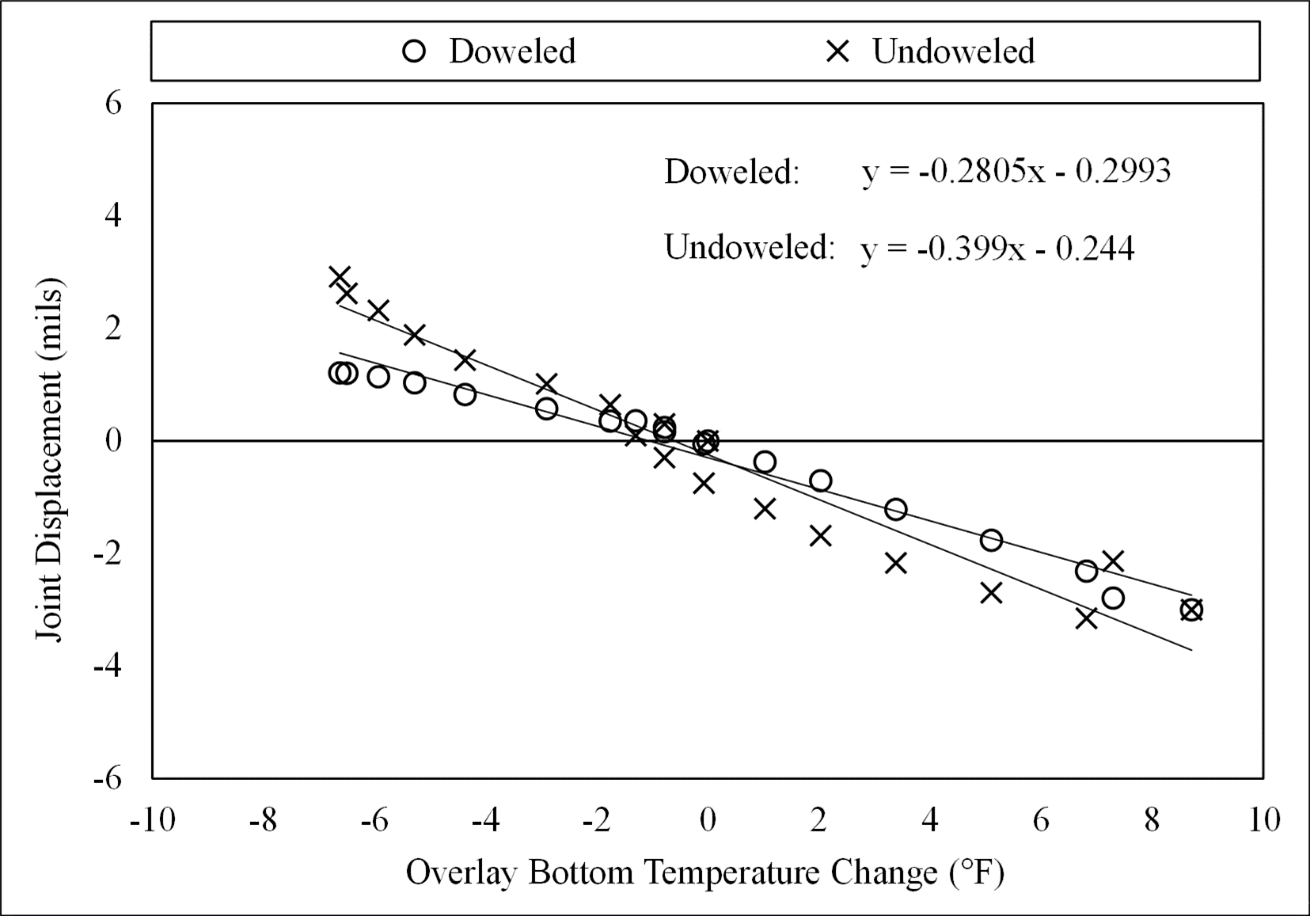
Figure 16. Joint Opening in Response to HMA Temperature Differential (Click Image to Zoom)
Return to RCOD Main Page