Reflective Cracking Outdoor Phase 1
Outdoor Phase I Test Summary
The Reflective Cracking Outdoor Phase I (RCOP-I) full-scale test started on February 11, 2020. After 2976 passes, testing concluded on February 18, 2020.
Objective
Most reflective cracking is caused by the combination of two mechanisms, as illustrated in Figure 1: (a) Horizontal Movement of Slab – usually temperature associated and causes tensile and bending stresses to develop in the overlay, and (b) Vertical Movement at the Joint/Crack Area – primarily load induced and creates shear and tensile stresses within the overlay. In addition, crack initiation and propagation are influenced by the existing pavement structure and conditions, reflective cracking countermeasures (e.g. reinforcing, interlayers), HMA mixture properties, the degree of load transfer at joints and cracks, and other effects.
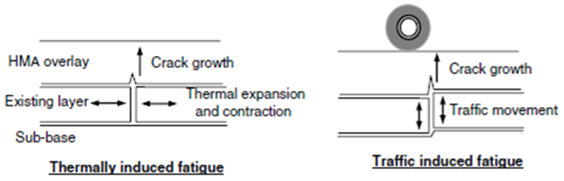
Figure 1. Mechanisms of Reflective Cracking [1] (Click to Zoom)
The crack propagation rate derived from the previous six full-scale indoor tests at the Federal Aviation Administration (FAA) National Airport Pavement Test Facility (NAPTF) using the Temperature Effect Simulation System (TESS), needed to be validated and calibrated to the field conditions that involves both aircraft and temperature loads. At the FAA National Airport Pavement and Material Research Center (NAPMRC), two test pavements were built and instrumented to isolate and compare aircraft gear load and temperature effects on the initiation and propagation of reflection cracks.
Pavement Design
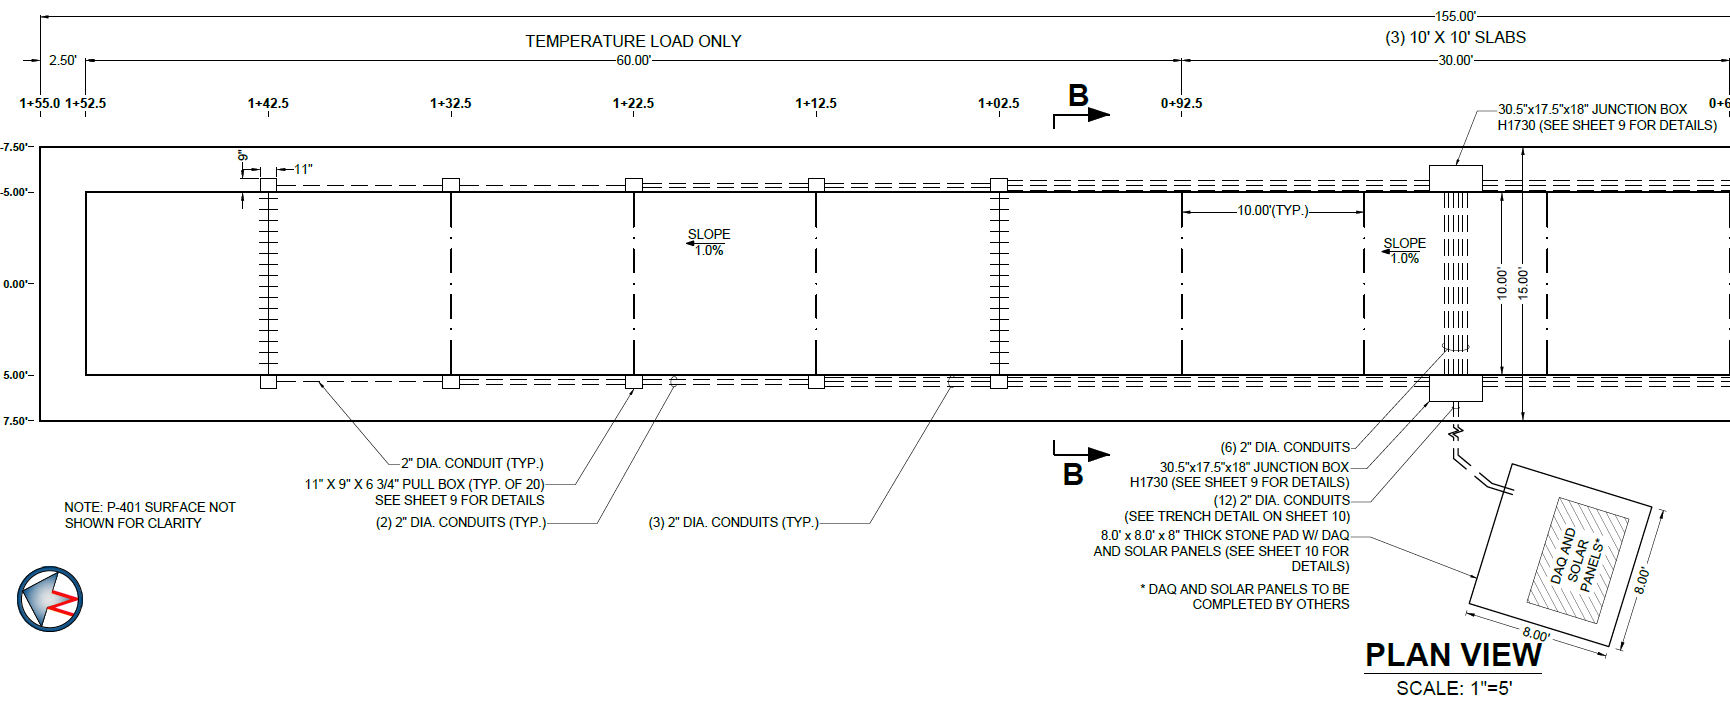
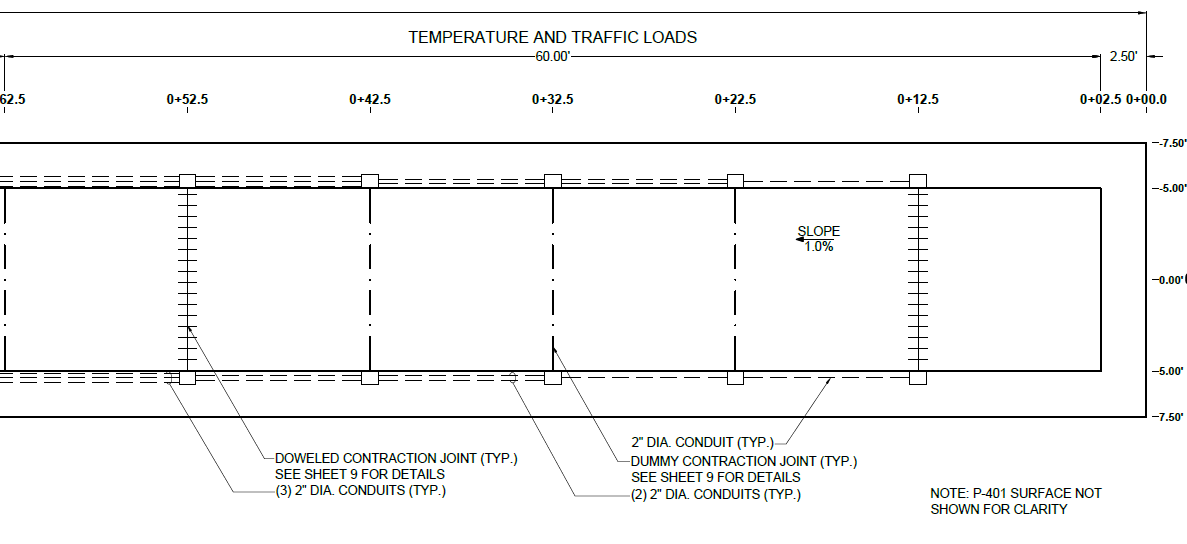
The RCOP-I test pavement was 155 feet long by 15 feet wide, and consisted of two test areas: the Temperature Only (TO) section, the Temperature and Traffic (TT) section, and a 30 foot long transition. The pavement structure included a 3 inch thick P-401MR HMA overlay, a 9 inch thick P-501MR concrete layer, an 8 inch thick P-154MR granular subbase, all on a prepared P-152MR subgrade (Figure 2). The P-501MR layer of each section (TO and TT) consists of six 10 × 10 foot slabs (Figure 3). All transverse joints were either Type C (Doweled Contraction Joint) or Type D (Undoweled/Dummy Contraction Joint). Since no stabilized base was present and the HMA overlay was relatively thin (3"), this overlaid rigid pavement structure may be considered representative of a non-hub or general aviation facility, i.e., not intended to handle heavy aircraft loads.
The As Built Drawings can be found here.
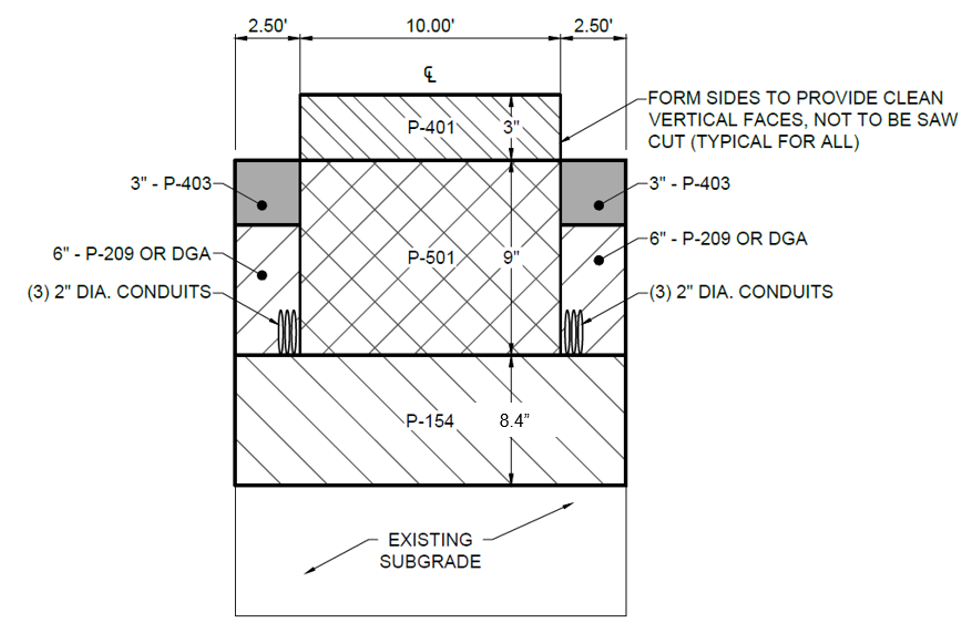
Figure 2. RCOP-I Pavement Cross-Section [2]. (Click to Zoom)
(a) (Click to Zoom)
(b) (Click to Zoom)
Figure 3. Reflective Cracking Outdoor Phase I Test Item Layout [2]
Construction
Daily notes taken during construction can be found here.
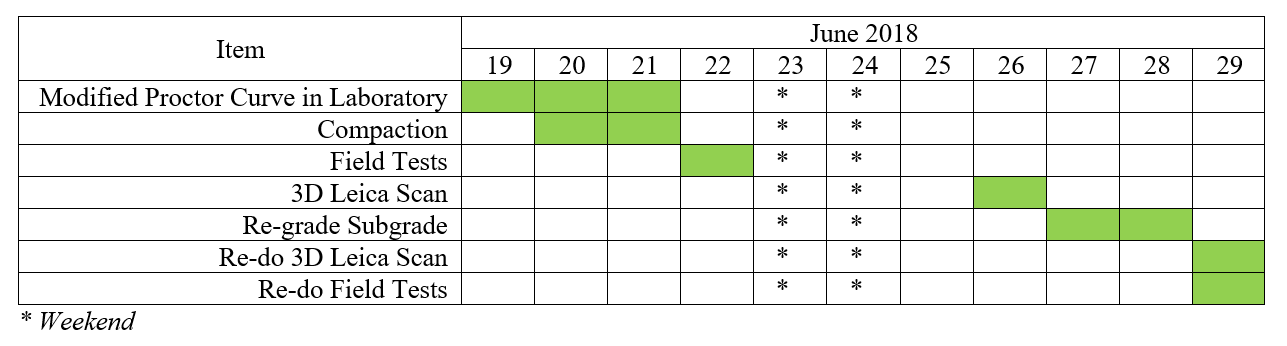
Subgrade (P-152MR) Construction
The construction of the subgrade started on June 19, 2018 and finished on June 29, 2018. Table 1 shows the breakdown for the construction activities. After the acceptance of P-152MR layer, field tests such as Light Weight Deflectometer (LWD), Portable Seismic Pavement Analyzer for Unbound Material (D-PSPA), and Dynamic Cone Penetrometer (DCP) were conducted according to the RC Outdoor Material Characterization Plan. The results of the field tests are reported in Appendix F of RCOP-I Construction History Report [2].
Table 1. Timeline for Construction of P-152MR Layer
Subbase (P-154MR) Construction
Placement of P-154MR material commenced on July 2, 2018 and completed on July 26, 2018. Table 2 shows the breakdown for the construction activities. Once the P-154MR layer was accepted, field tests were then conducted on the top of P-154MR, which are documented in Appendix G of RCOP-I Construction History Report [2].
Table 2. Timeline for Construction of P-154MR Layer
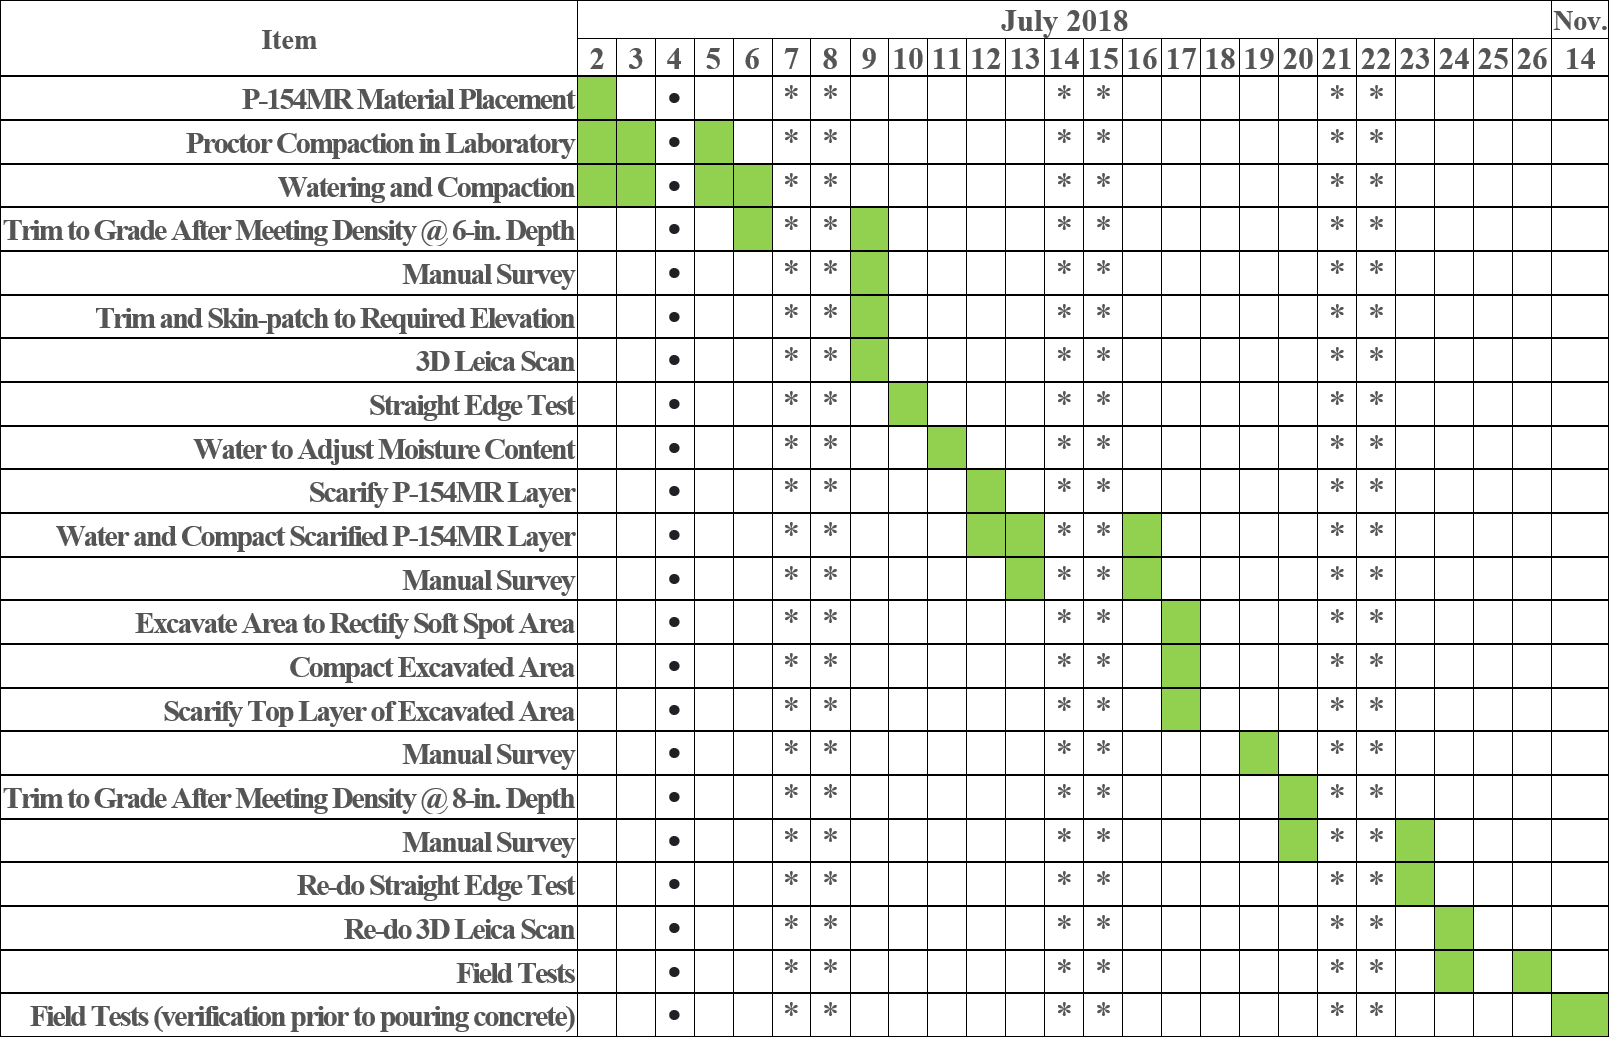
• Holiday
* Weekend
Concrete (P-501MR) Paving
The P-501MR layer was placed on December 4, 2018 and 7 days later the formwork was removed on December 12, 2018. On the next day, concrete joints were saw cut and sealed per the Construction Plans. After 28 days of curing, field tests including the Heavy Weight Deflectometer (HWD) and Portable Seismic Pavement Analyzer (PSPA) were conducted on January 3, 2019. A summary of material characterization, field test results, and analysis can be found in Appendix I of RCOP-I Construction History Report [2].
Shoulder (P-209MR and P-403MR) Construction
On April 4, 2019, P-209MR base material was placed around the concrete slabs and 3 inches below the surface of P-501MR layer, which was compacted using a plate compactor. Once the P-209MR shoulder met the acceptance requirements, PG 64-22 P-403MR HMA was installed and compacted on the top of P-209MR shoulder. The Nuclear Gauge was then used to verify the compaction requirements. Results of both acceptance and laboratory testing the shoulder materials were reported in Appendix J of RCOP-I Construction History Report [2].
Surface HMA (P-401MR) Paving
Placement of surface PG 64-22 P-401MR HMA layer occurred on April 30, 2019. The surface layer was placed in a single lift at a compacted thickness of 3 inches in the 10 foot wide paving lane. Prior to paving, embedded sensors (on top of P-501MR) were covered with HMA materials. Compaction, using rollers, continued as needed until field densities met the P-401MR specification. After compaction, the edges of the P-401MR layer were saw cut on May 22, 2019 to create a smooth vertical surface. Loose HMA samples were also obtained from the asphalt plant to verify HMA mix design. The P-401MR mix verification was conducted at the asphalt plant (A.E. Stone) as well as in the NextGen Materials Testing Laboratory. Field core samples were extracted from the transition area for density acceptance testing, as summarized in Appendix L of RCOP-I Construction History Report [2].
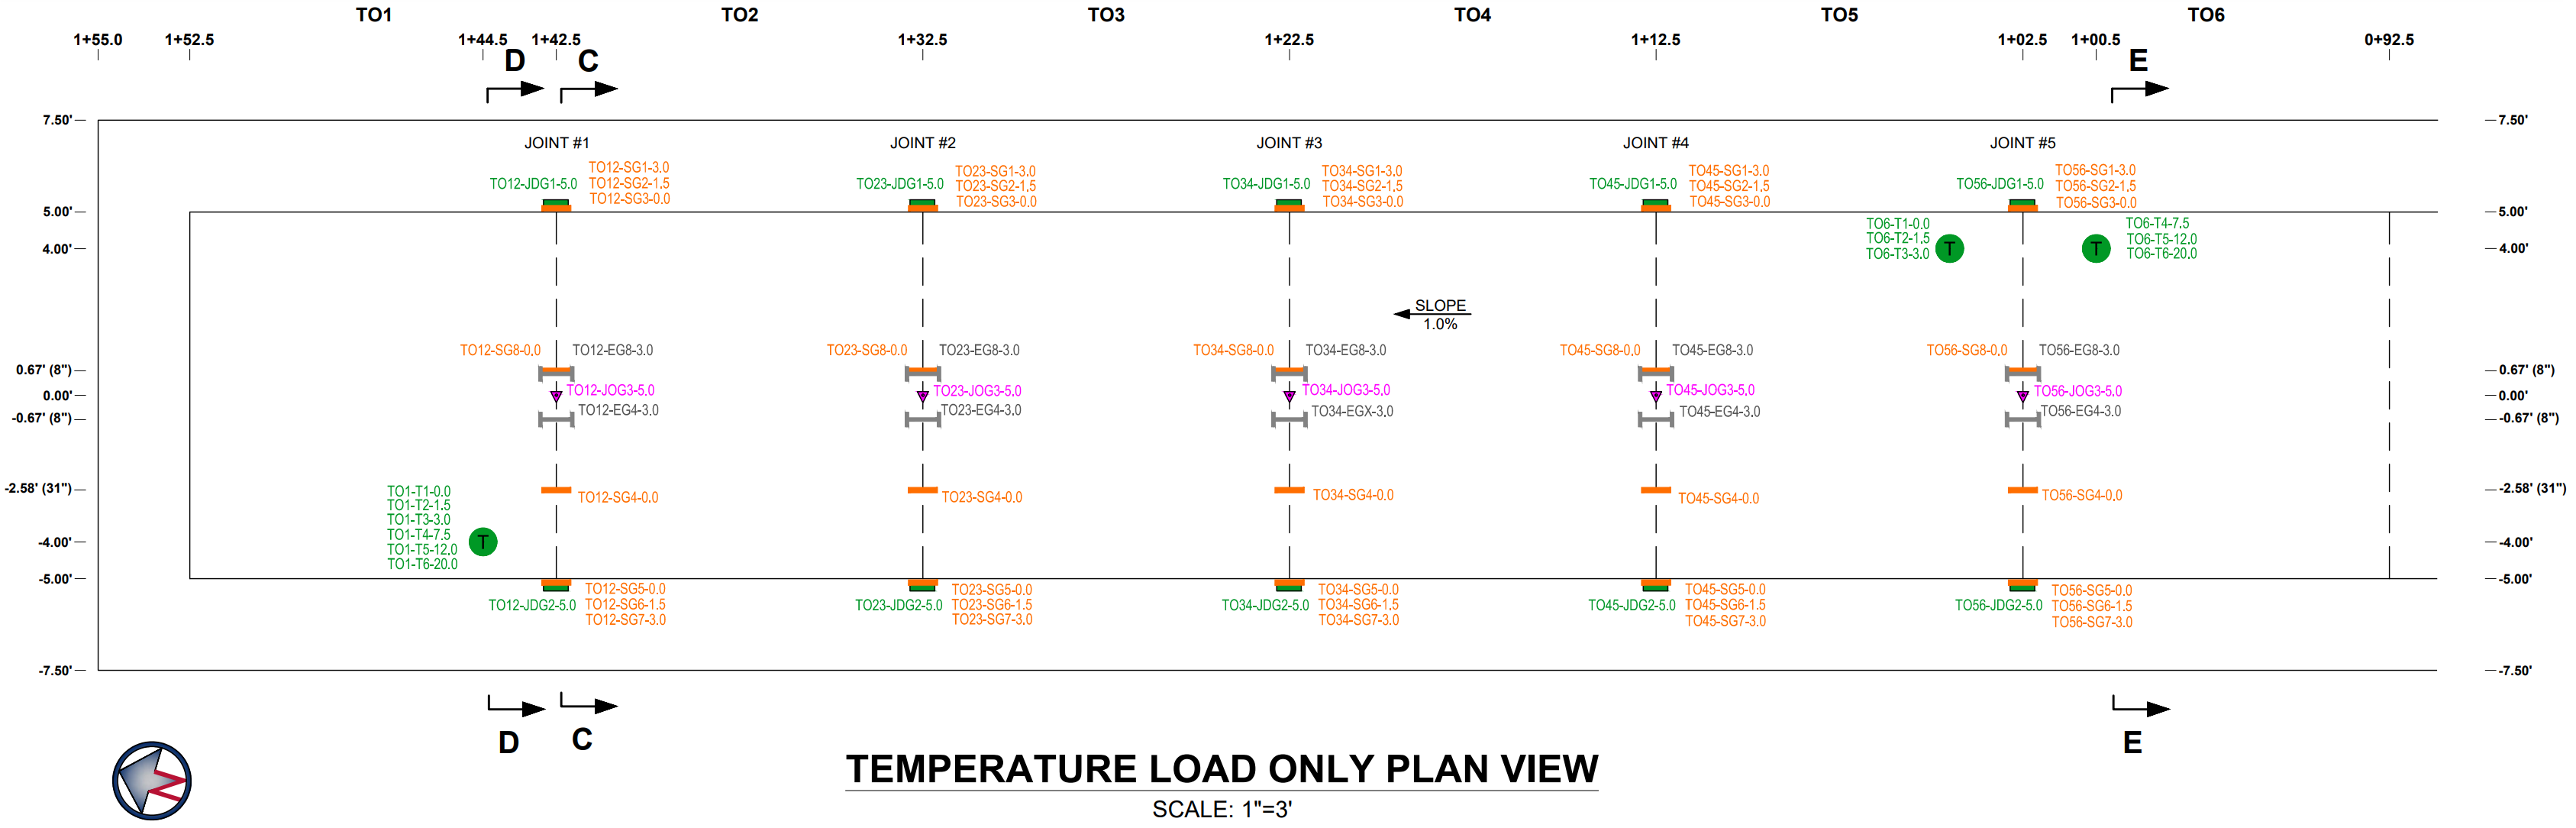
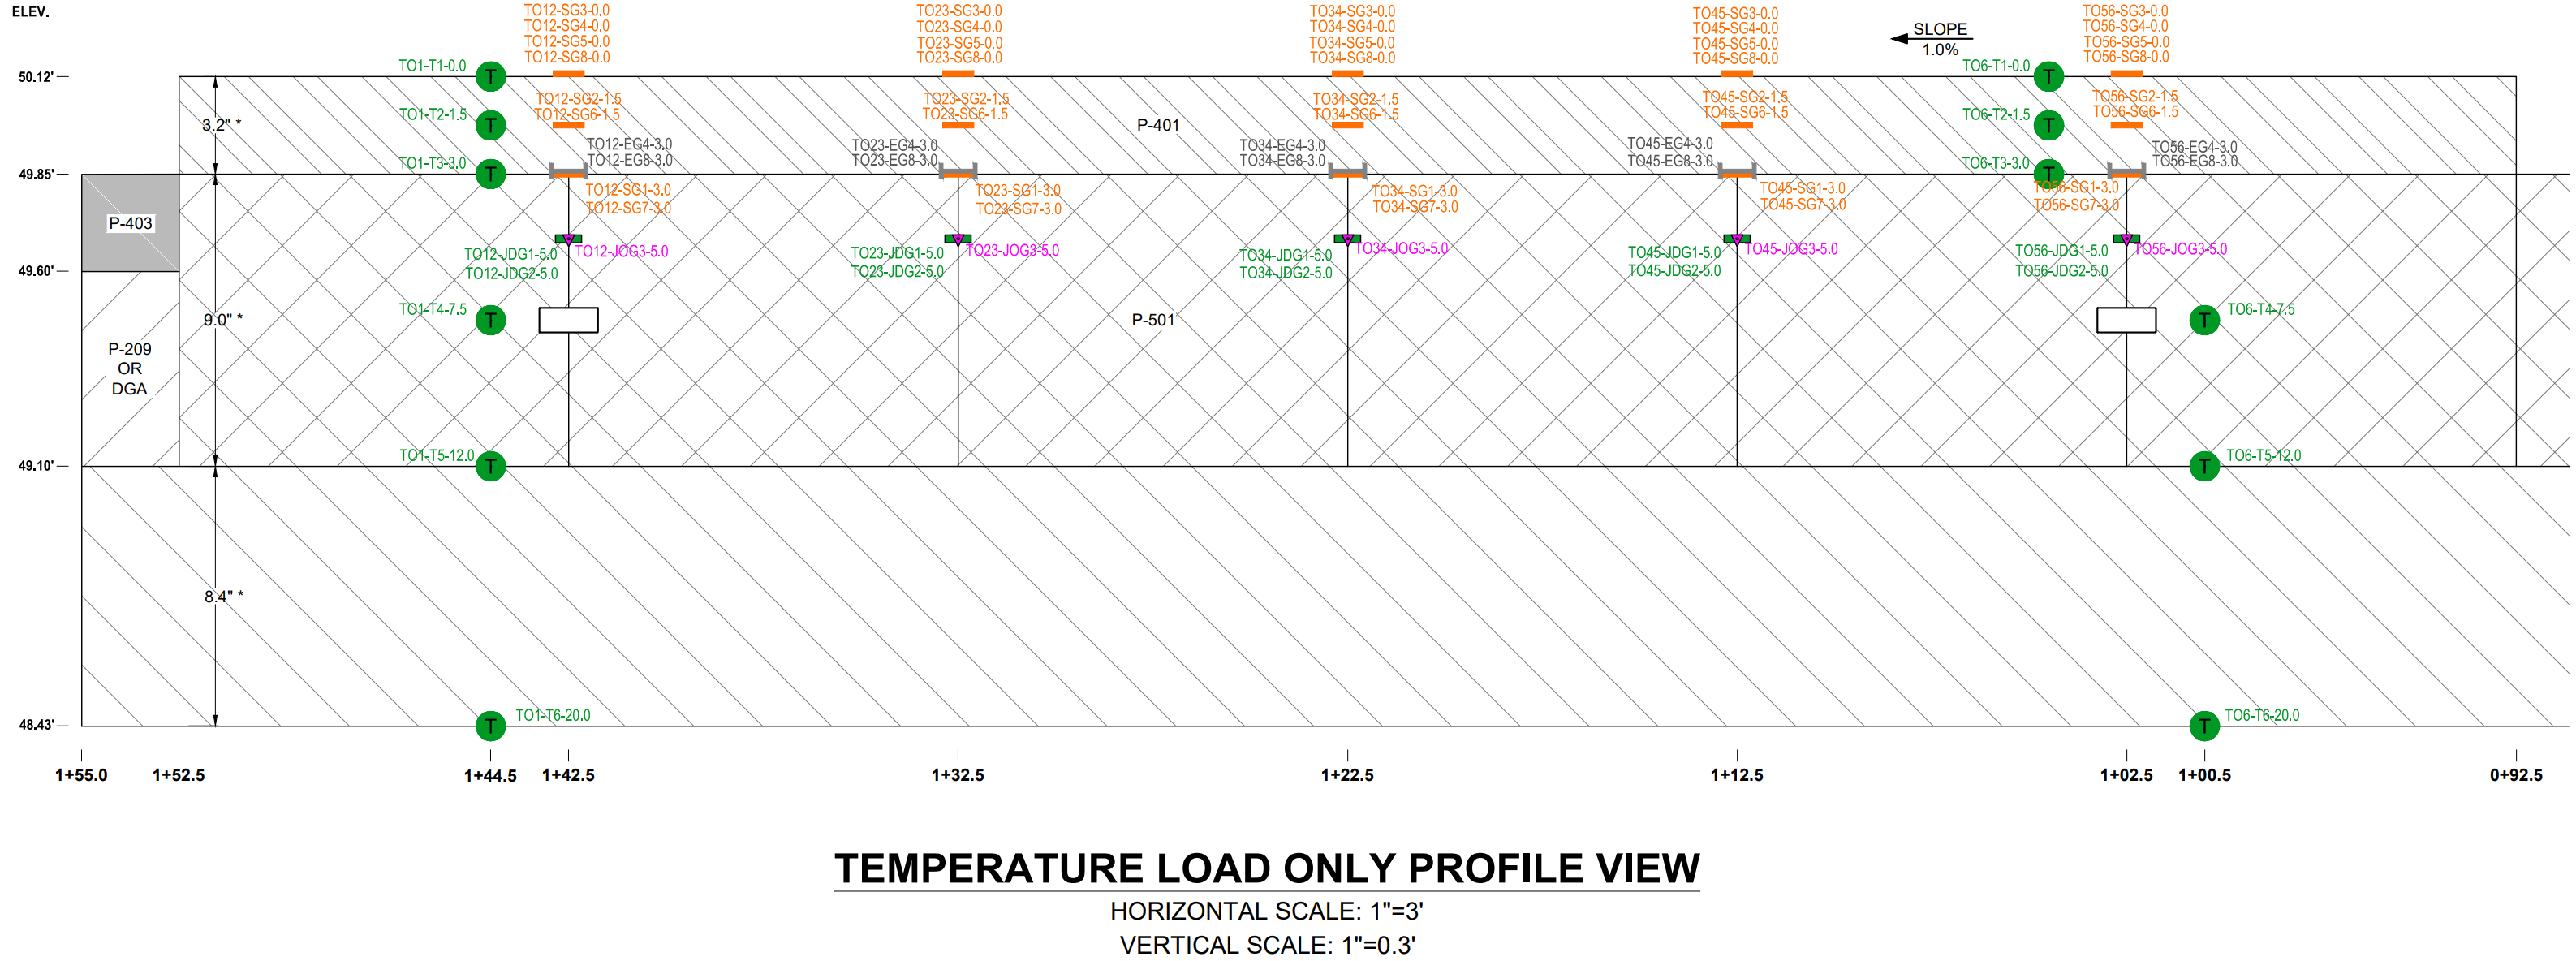
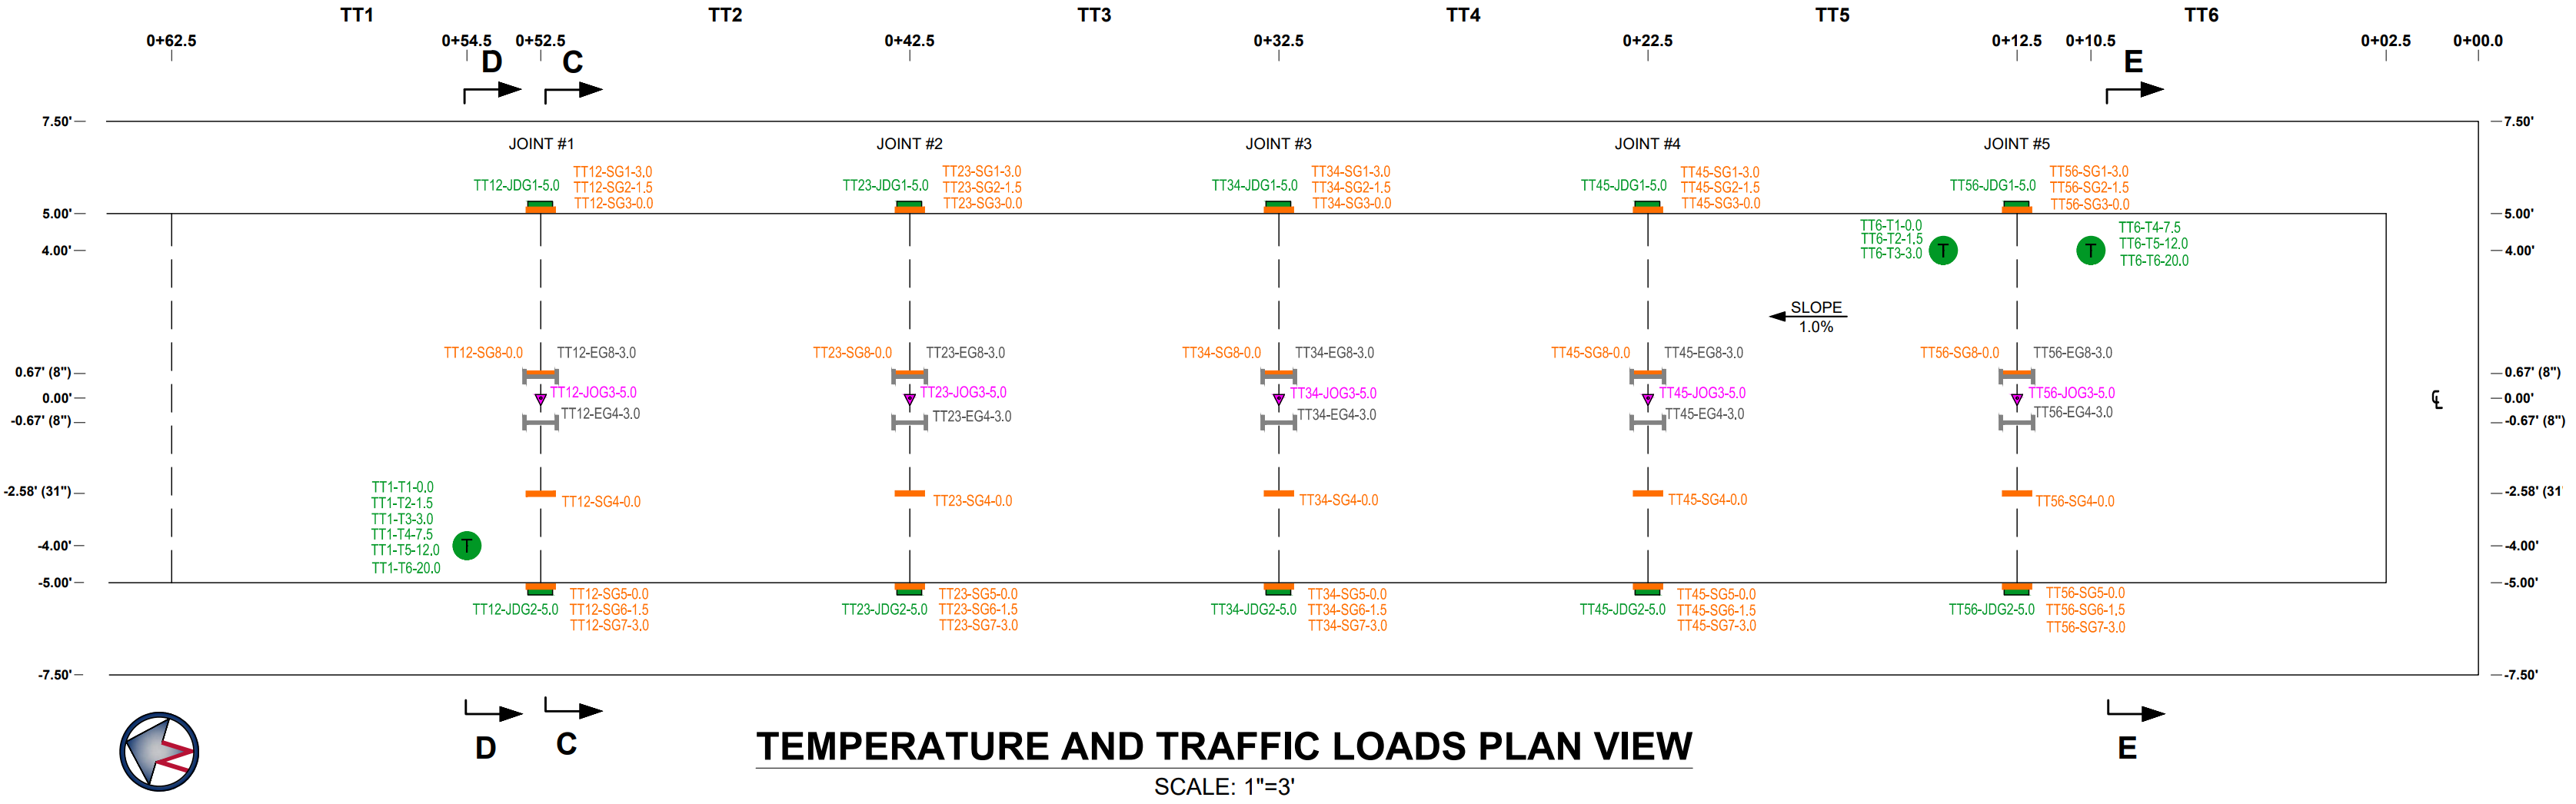
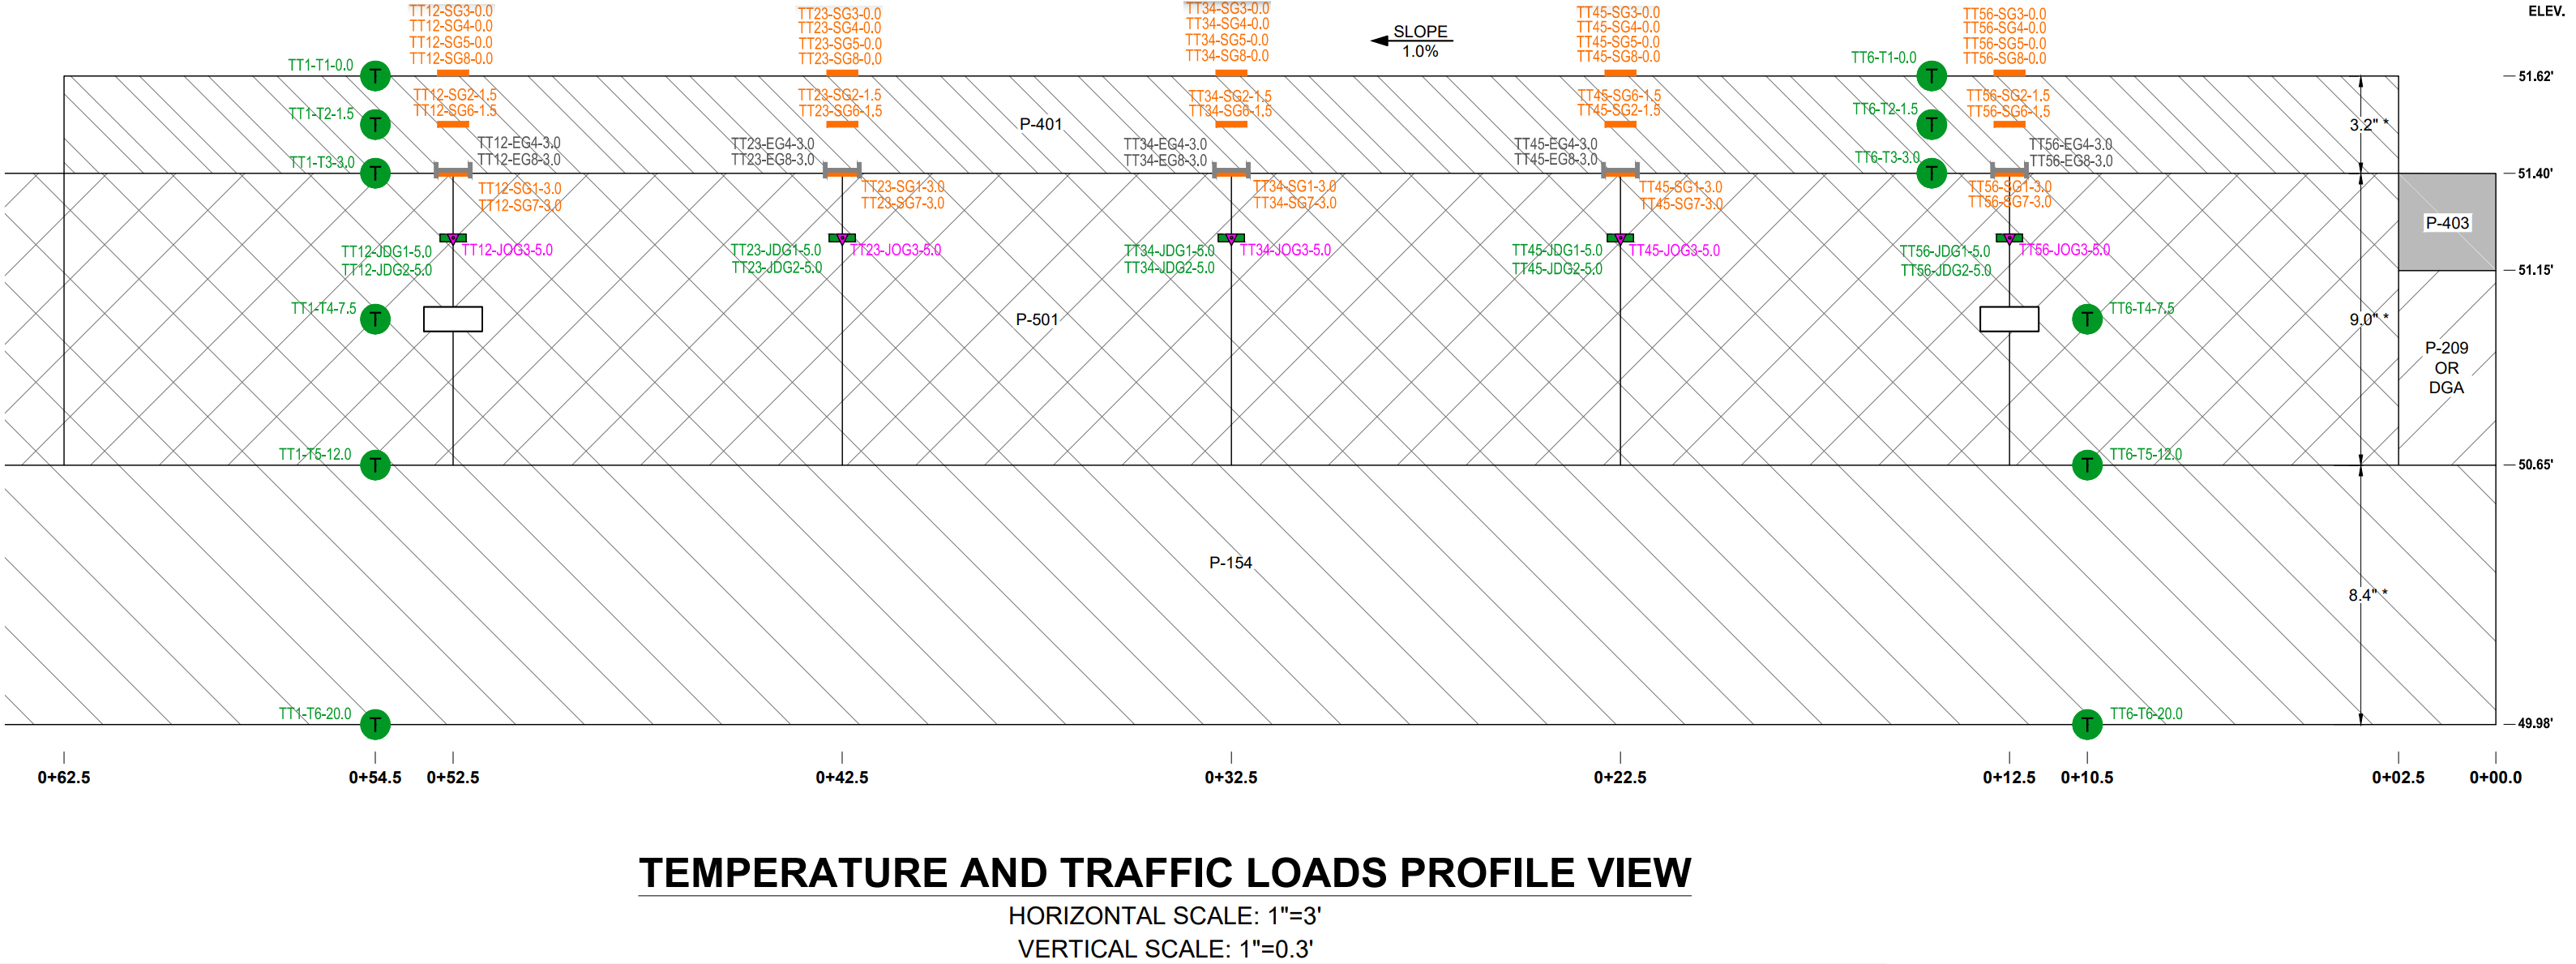
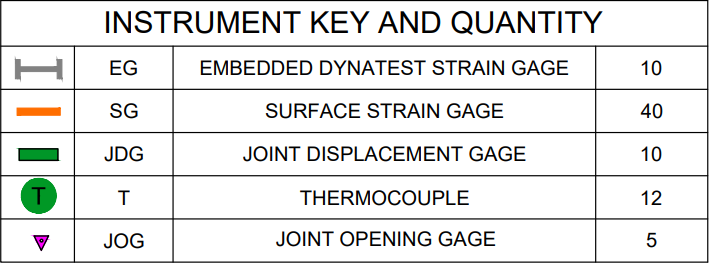
Instrumentation
Figure 4 shows the instrumentation layout. On the TO section, a total of 10 joint displacement gages (JDG) were installed on the side of concrete slabs. A total of 10 asphalt strain gages (EG) were embedded at HMA overlay bottom directly above the concrete joint. These gages were placed at two offset locations (+/- 0.67feet) from the centerline of the test pavement. There were also surface strain gages (SG) installed. Thermocouples (T) were installed with an arrangement: (a) one array of six at the south-west corner of Slab TO1, and (b) one array of six at the north-east corner of Slab TO6. Thermocouples were placed at three depths as shown in Figure 4(b) and (d). The TT section has an identical instrumentation layout, as shown in Figure 4(c) and (d).
The As Built Drawings can be found here.
(a) (Click to Zoom)
(b) (Click to Zoom)
(c) (Click to Zoom)
(d) (Click to Zoom)
(e) (Click to Zoom)
Figure 4. Reflective Cracking Outdoor Phase I Instrumentation Layout [2]
Testing Protocol
The traffic test was conducted over a 5-day period that commenced on February 11, 2020 and concluded on February 18, 2020. The trafficking by the FAA Heavy Vehicle Simulator-Airfields (HVS-A) was on the TT test section only, using a single wheel load of 40,000 pounds, vehicle speed of 3.0 mph, and nominal tire pressure of 214 psi according to the RCOP-I Comprehensive Test Plan [3]. Table 3 summarizes the traffic history. The wander pattern is shown in Figure 5. In addition to monitoring both dynamic and static instrumentation data, manual distress surveys were conducted at the end of each trafficking day. At the conclusion of traffic testing on February 18, 2020, the cumulative pass number was 2976.
Daily notes taken during testing can be found here.
Table 3. Traffic History on TT Section
|
Day
|
Date
|
Time
|
Passes
|
Cumulative Passes
|
Wander Number
|
|
1
|
02/11/2020
|
6:56AM – 12:30PM
|
496
|
496
|
8
|
|
2
|
02/12/2020
|
6:56AM – 1:30PM
|
666
|
1162
|
10
|
|
3
|
02/13/2020
|
6:46AM – 1:53PM
|
574
|
1736
|
10
|
|
4
|
02/14/2020
|
6:40AM – 1:08PM
|
620
|
2356
|
10
|
|
5
|
02/18/2020
|
6:46AM – 1:36PM
|
620
|
2976
|
10
|
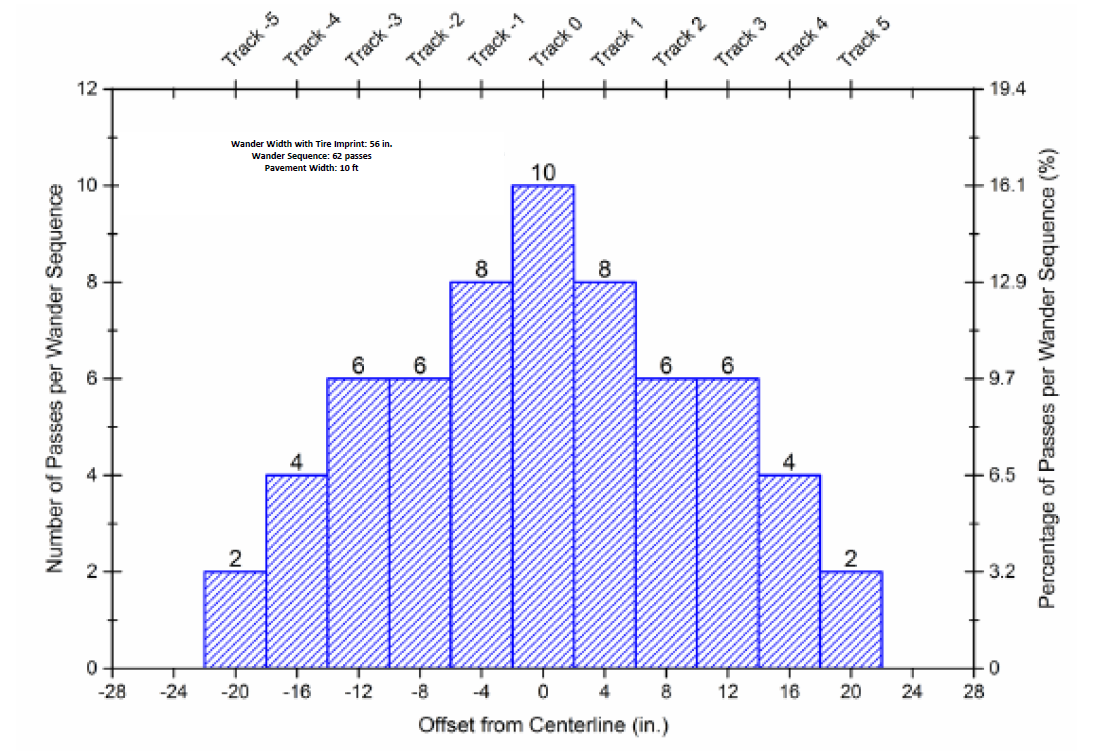
Figure 5. Wander Pattern [3] (Click to Zoom)
Observations
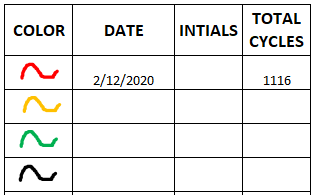
Daily distress surveys were conducted in accordance with ASTM D5340 [4]. Distresses were outlined with chalk and measured using a tape measure. The surveys recorded the changes to existing distresses and any new distresses. Visual distress surveys were documented in two ways: a scale map and a written log. The distress map shows all distresses to scale and keys each distress to a pass number/cycle number and joint ID. Figure 6 shows sample distress maps for both joints TT34 and TO34. At each joint, distresses were recorded on the top, west, and east vertical edges. Distresses are numbered for reference to the written log. The written log records all the distress information chronologically. Figure 7 is a screenshot of part of the log. The written log records the date, pass number, type of distress, distress number (which can be cross-referenced to the distress map), the location of the distress, and any relevant notes. The notes may indicate changes to existing distresses, severity levels, merging of multiple previously identified distresses, etc.
The complete Distress Map and Log can be found here.
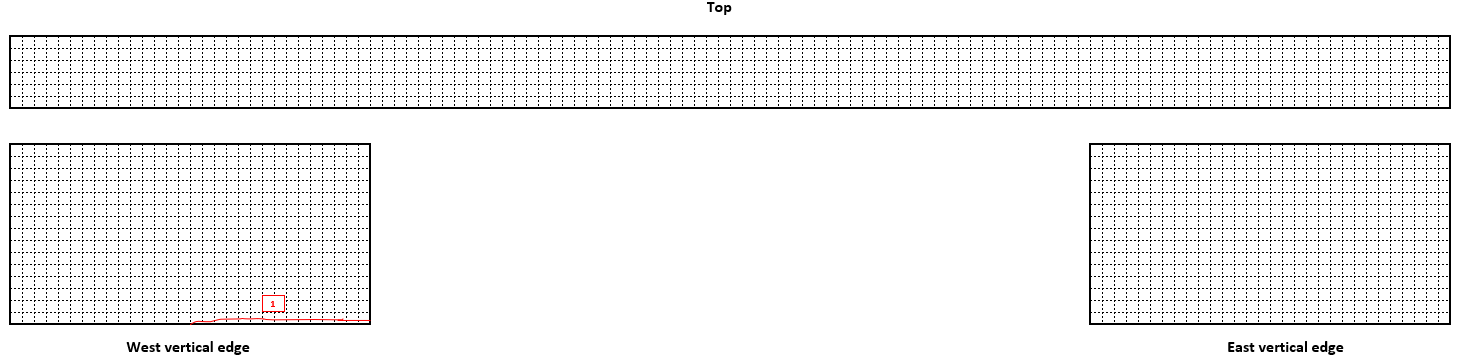
(a) TT34 Joint of TT Section (Click to Zoom)
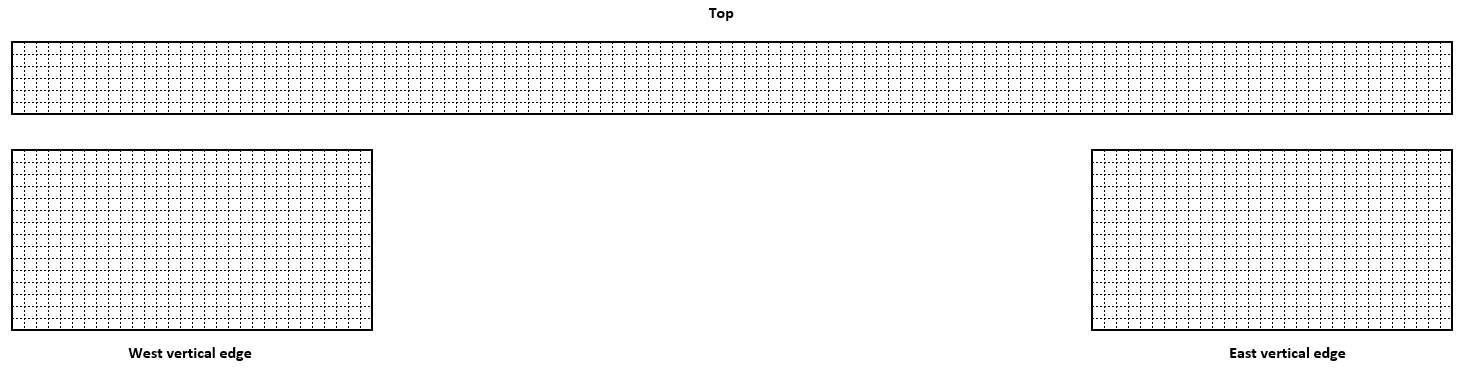
(b) TO34 Joint of TO Section (Click to Zoom)
Figure 6. Sample Distress Map (Portion)
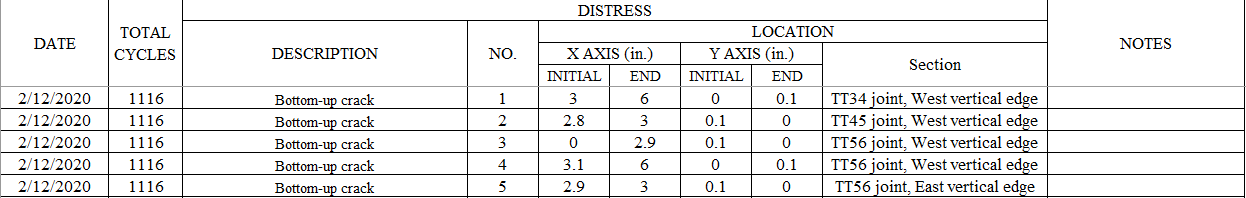
Figure 7. Sample Log (Portion) (Click to Zoom)
As shown in Table 4, reflection cracks were first observed on the 2nd day of traffic testing (i.e., February 12, 2020) after cumulative pass #1162. These cracks were located on both the east and west sides along joint TT34, TT45, and TT56. After initiation, the progress of bottom-up cracks varied. For instance, on the west side of joint TT45, the crack reached 1.4 inch mark from the overlay bottom, as reported on February 14, 2020, after cumulative pass #2356.
Table 4. Traffic History and Distress Observation on TT Section
|
Day
|
Date
|
Cumulative Passes
|
Distress Observation
|
|
1
|
2/11/2020
|
496
|
No crack initiated
|
|
2
|
2/12/2020
|
1162
|
(a) TT34 joint west side: 3 mm (approximate) vertical hairline crack, in asphalt at concrete joint, then the hairline crack moved to the right for 40 mm (approximate) parallel to the concrete surface
(b) TT45 joint west side: 10 mm (approximate) vertical hairline crack, in asphalt at concrete joint at approximately 45 degrees to the left, then the hairline crack moved to the right for 40 mm (approximate) parallel to the concrete surface
(c) TT45 joint east side 4 mm (approximate) vertical hairline crack, in asphalt at concrete joint at approximately 45 degrees to the left, then the hairline crack moved to the right for 40 mm (approximate) parallel to the concrete surface
(d) TT56 joint west side: 2 hairline vertical cracks 4 mm each at the joint then moved 50 mm individually one to the right the other to the left of joint parallel to the concrete surface
(e) TT56 joint east side: 4 mm (approximate) vertical hairline crack, in asphalt at concrete joint, then the hairline crack moved to the right for 30 mm (approximate) parallel to the concrete surface
|
|
3
|
2/13/2020
|
1736
|
No further propagation observed on the existing crack
|
|
4
|
2/14/2020
|
2356
|
(a) TT45 joint west side: Bottom up crack reaches the height of 1.4 inch
(b) No further propagation observed on other joints
|
|
5
|
2/18/2020
|
2976
|
No further propagation observed on the existing crack
|
Preliminary Analysis
Figure 8 shows the temperature data at the top, middle, and bottom of HMA overlay on the TO section. During daytime, temperature increased until mid-afternoon (within 2:00 PM – 3:00 PM), followed by a gradual drop until the next morning. Throughout the 5-day trafficking, the lowest overlay temperature was always at the surface. This observation is opposite to the temperature gradient from Reflective Cracking Indoor Tests where the bottom-up cooling scheme resulted in the lowest temperatures at the overlay bottom. One of such examples from Indoor Phase V Test is given in Figure 9.
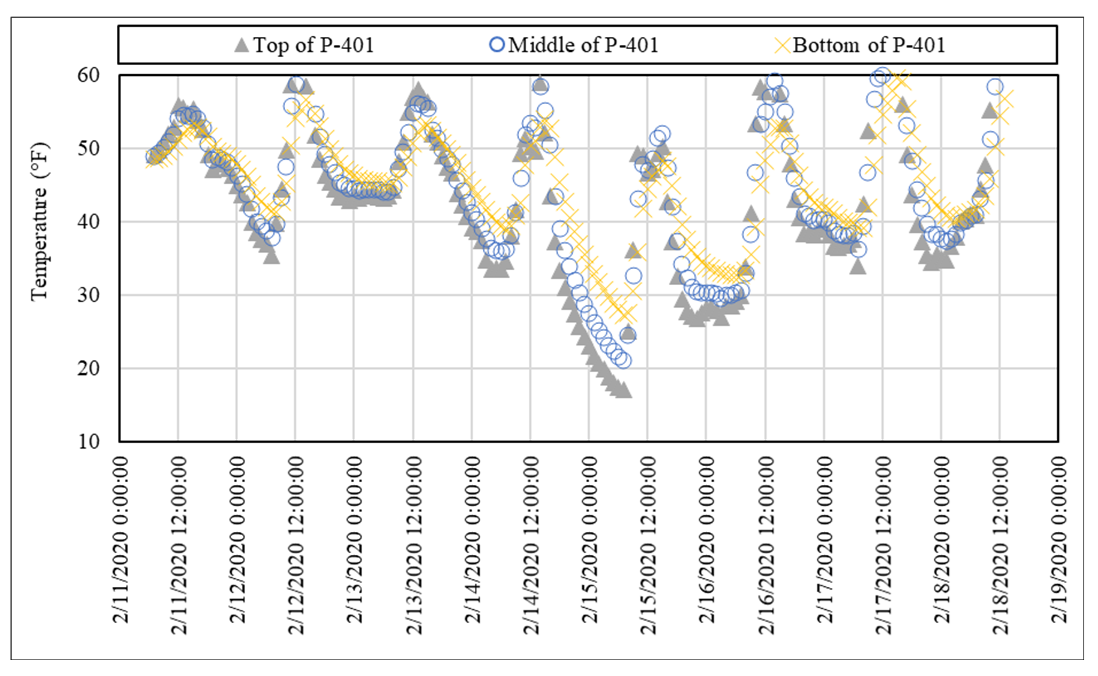
Figure 8. Temperature Variations in HMA Overlay (5 day of Trafficking) (Click to Zoom)
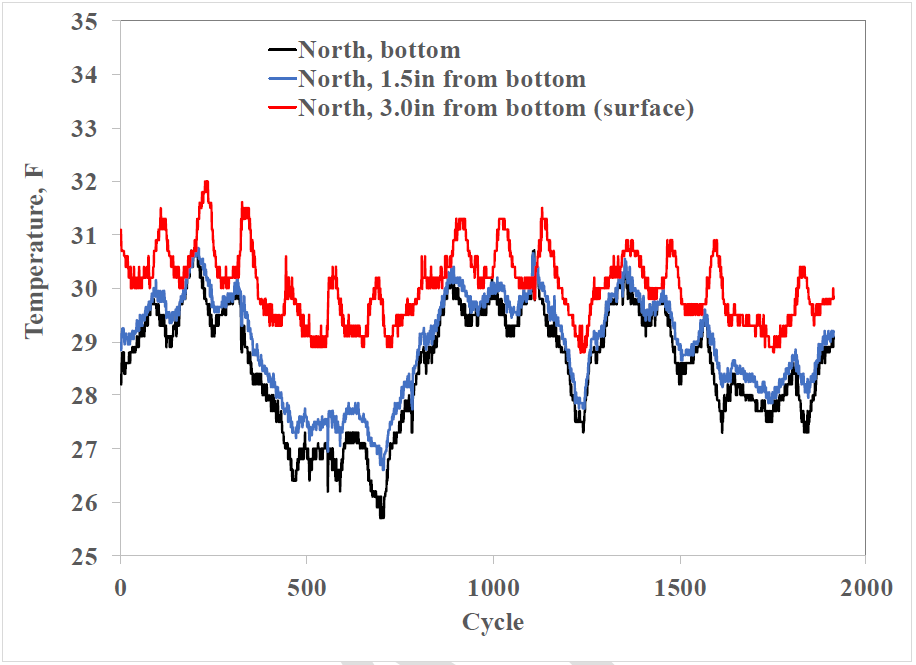
Figure 9. Temperature Variation in HMA Overlay (from RC Indoor Phase V) [5] (Click to Zoom)
Advanced Analysis
Crack Characterization
On February 12, 2020 (2nd day of trafficking), the first bottom-up crack was observed on the west vertical edge of joint TT45 (undoweled joint) after cumulative pass #496 (Figure 10). In Figure 11, some strain fluctuation from the bottom SG first manifested at cumulative pass #507, while strains from the upper two SGs remained fairly stable. Crosscheck of joint displacement readings from TT45-JDG2-5 identified the initial jump at the same pass number (Figure 12). Therefore, the pass number corresponding to the crack initiation at this location was determined to be 507.
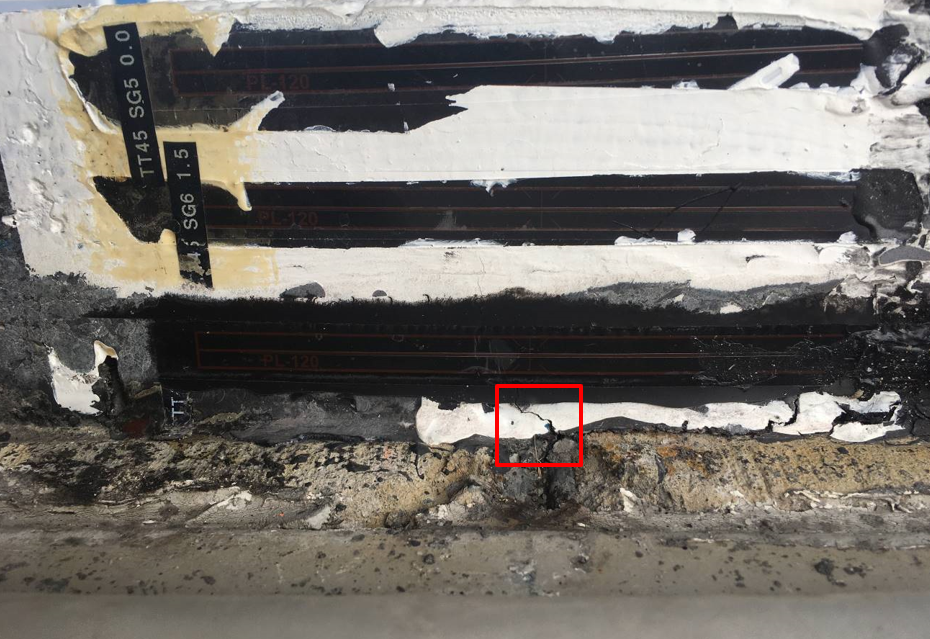
Figure 10. 1st Bottom-up Crack on the West Edge of TT45 (February 12, 2020) (Click to Zoom)
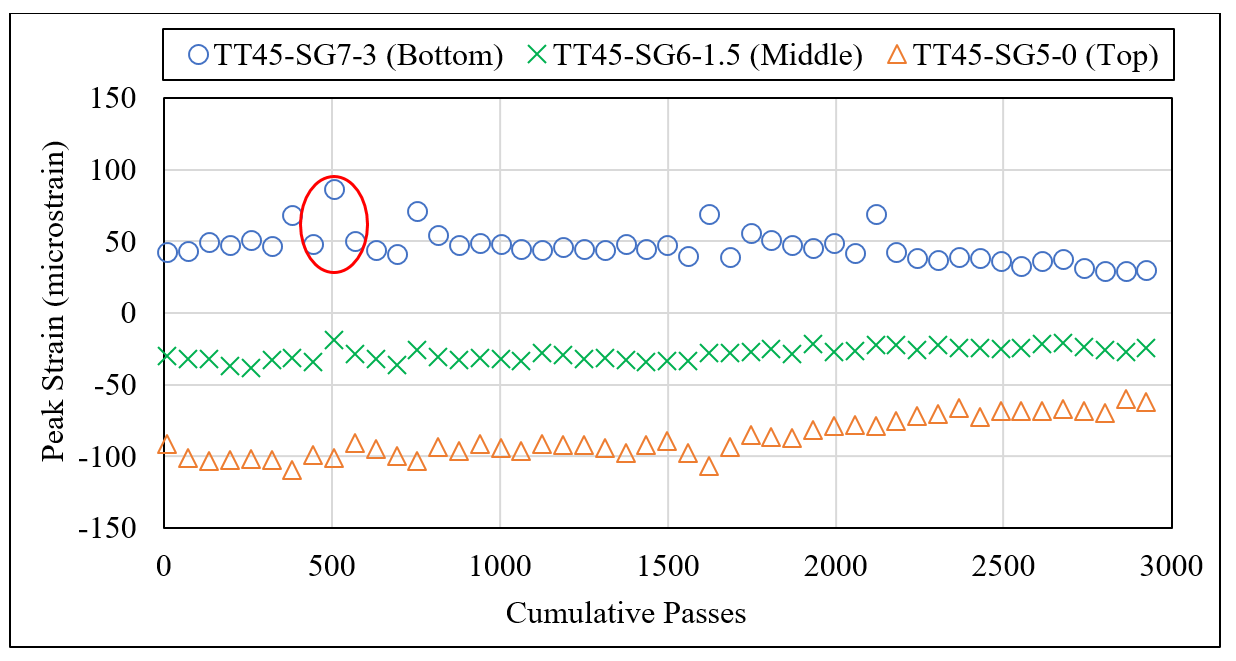
Figure 11. SG Response over Pass Number at the West Edge of TT45 (Click to Zoom)
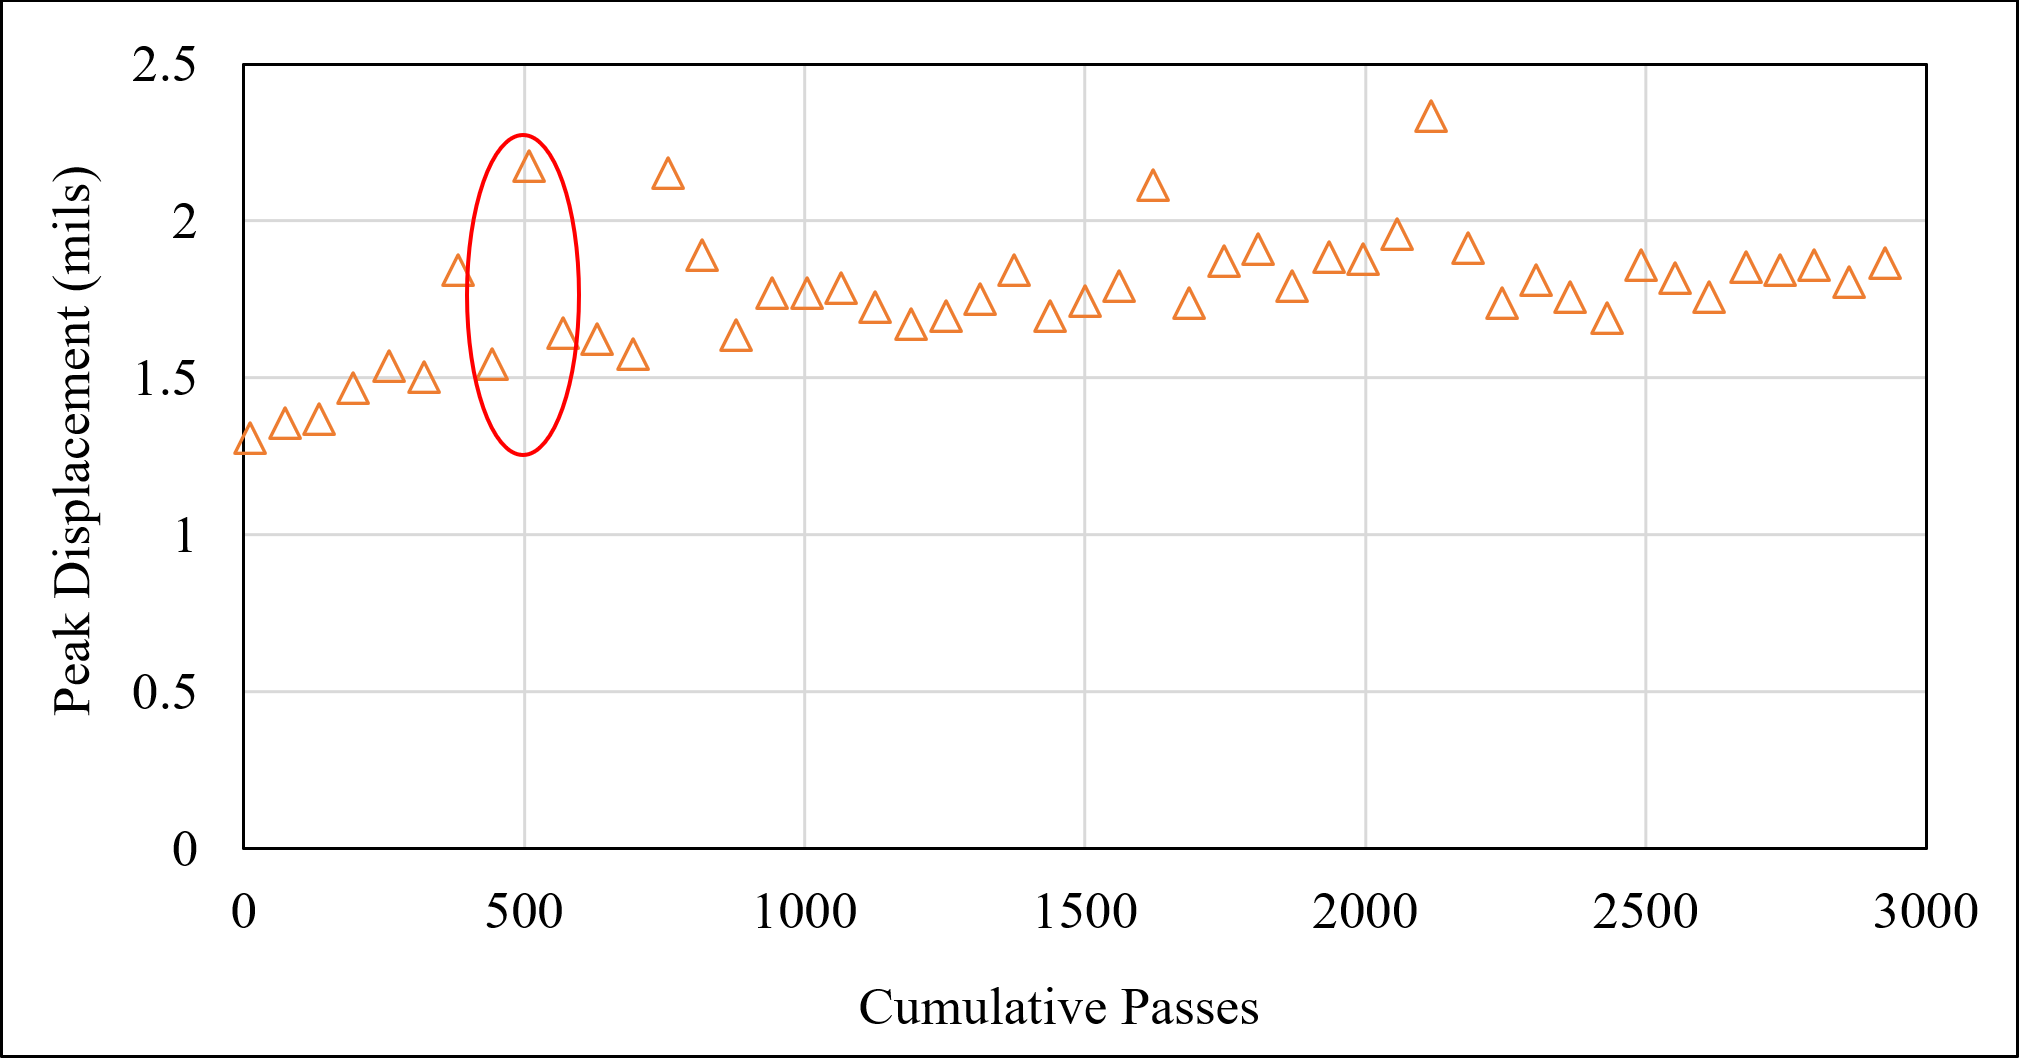
Figure 12. Joint Displacement at the West Edge of TT45 (Click to Zoom)
Following the analysis of Indoor Phase VI Test data, cumulative strain energy was calculated using the tensile strains from TT45-SG7-3.0. As shown in Figure 13, there was an apparent upshift in the trend of cumulative strain energy at pass #507. This observation further confirmed the timestamp of the bottom-up crack initiation.
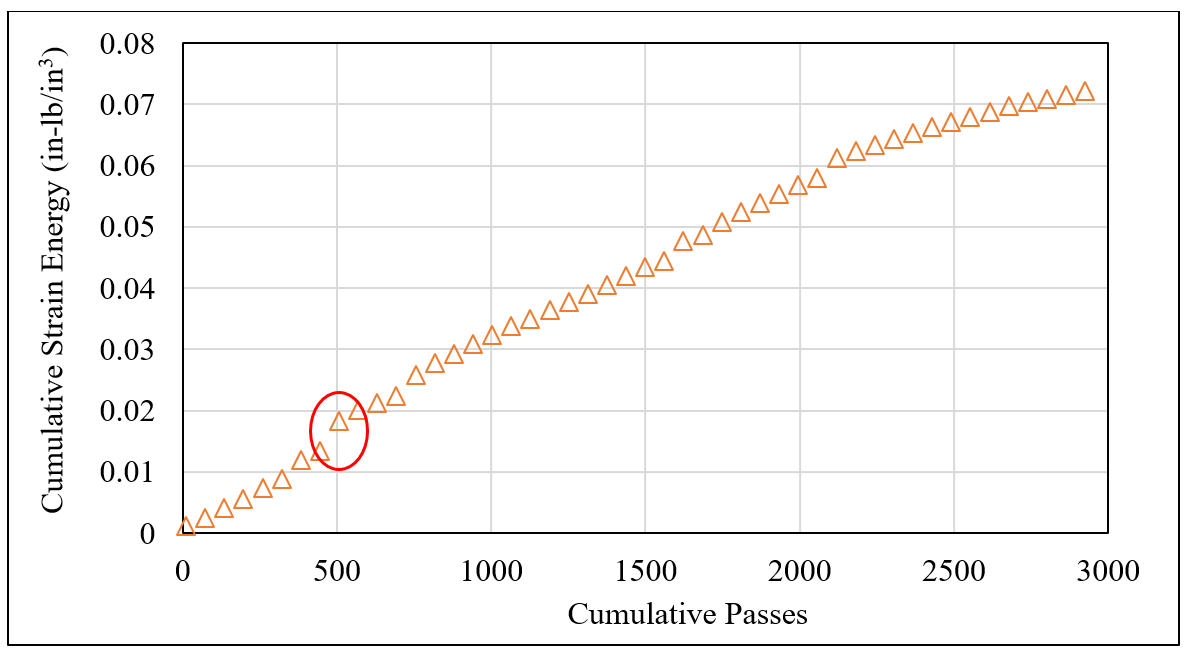
Figure 13. Cumulative Strain Energy Calculated from TT45-SG7-3.0 along West Edge of TT45 (Click to Zoom)
Joint Movement
During the traffic test, the TT section experienced a mixed loading of both traffic load using SWL and temperature variation. Hence, one doweled joint (TO12) and one undoweled joint (TO23) from the TO section were selected to study the temperature induced joint movement. As expected, Figures 14 and 15 show that the joint displacements at the doweled joint were smaller than the undoweled joint displacements.
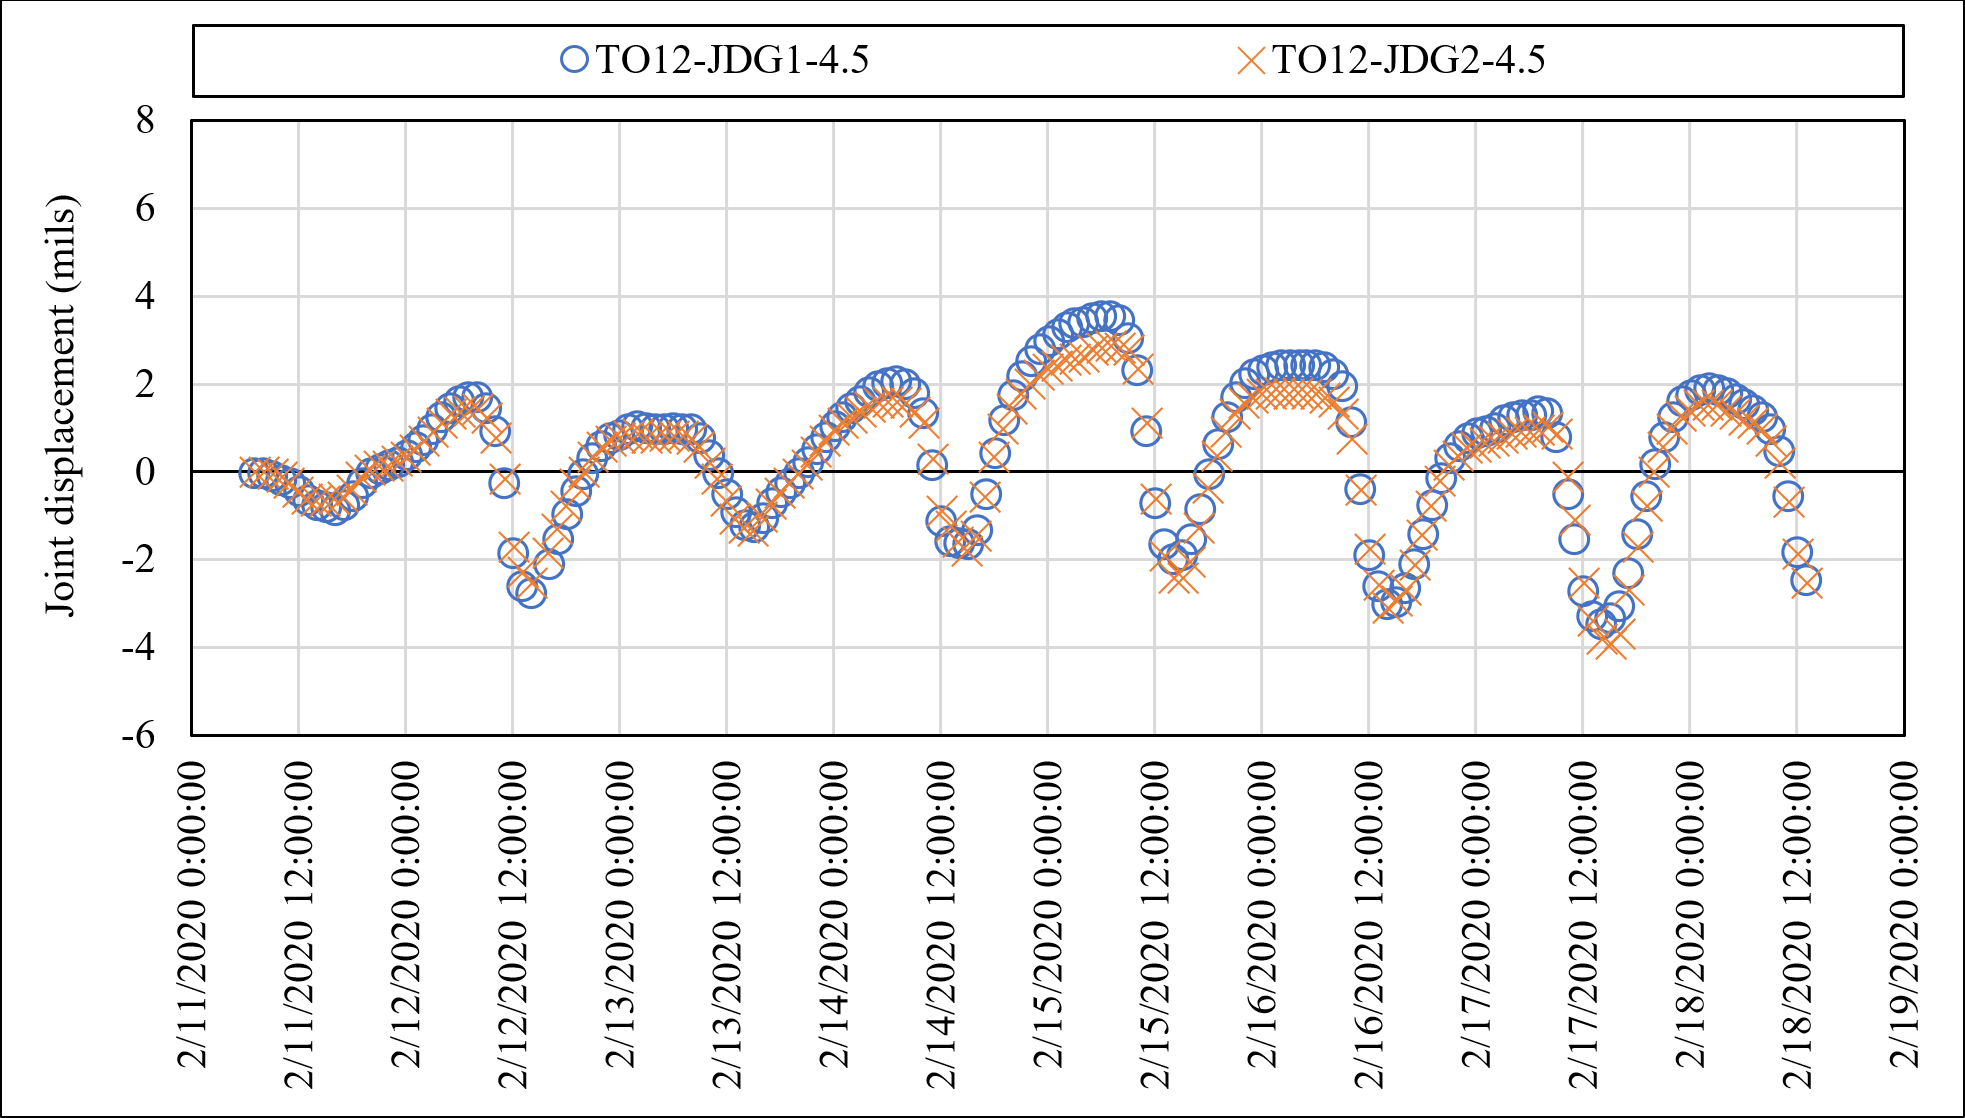
Figure 14. Joint Displacement along Doweled Joint (over 5-days of Trafficking) (Click to Zoom)
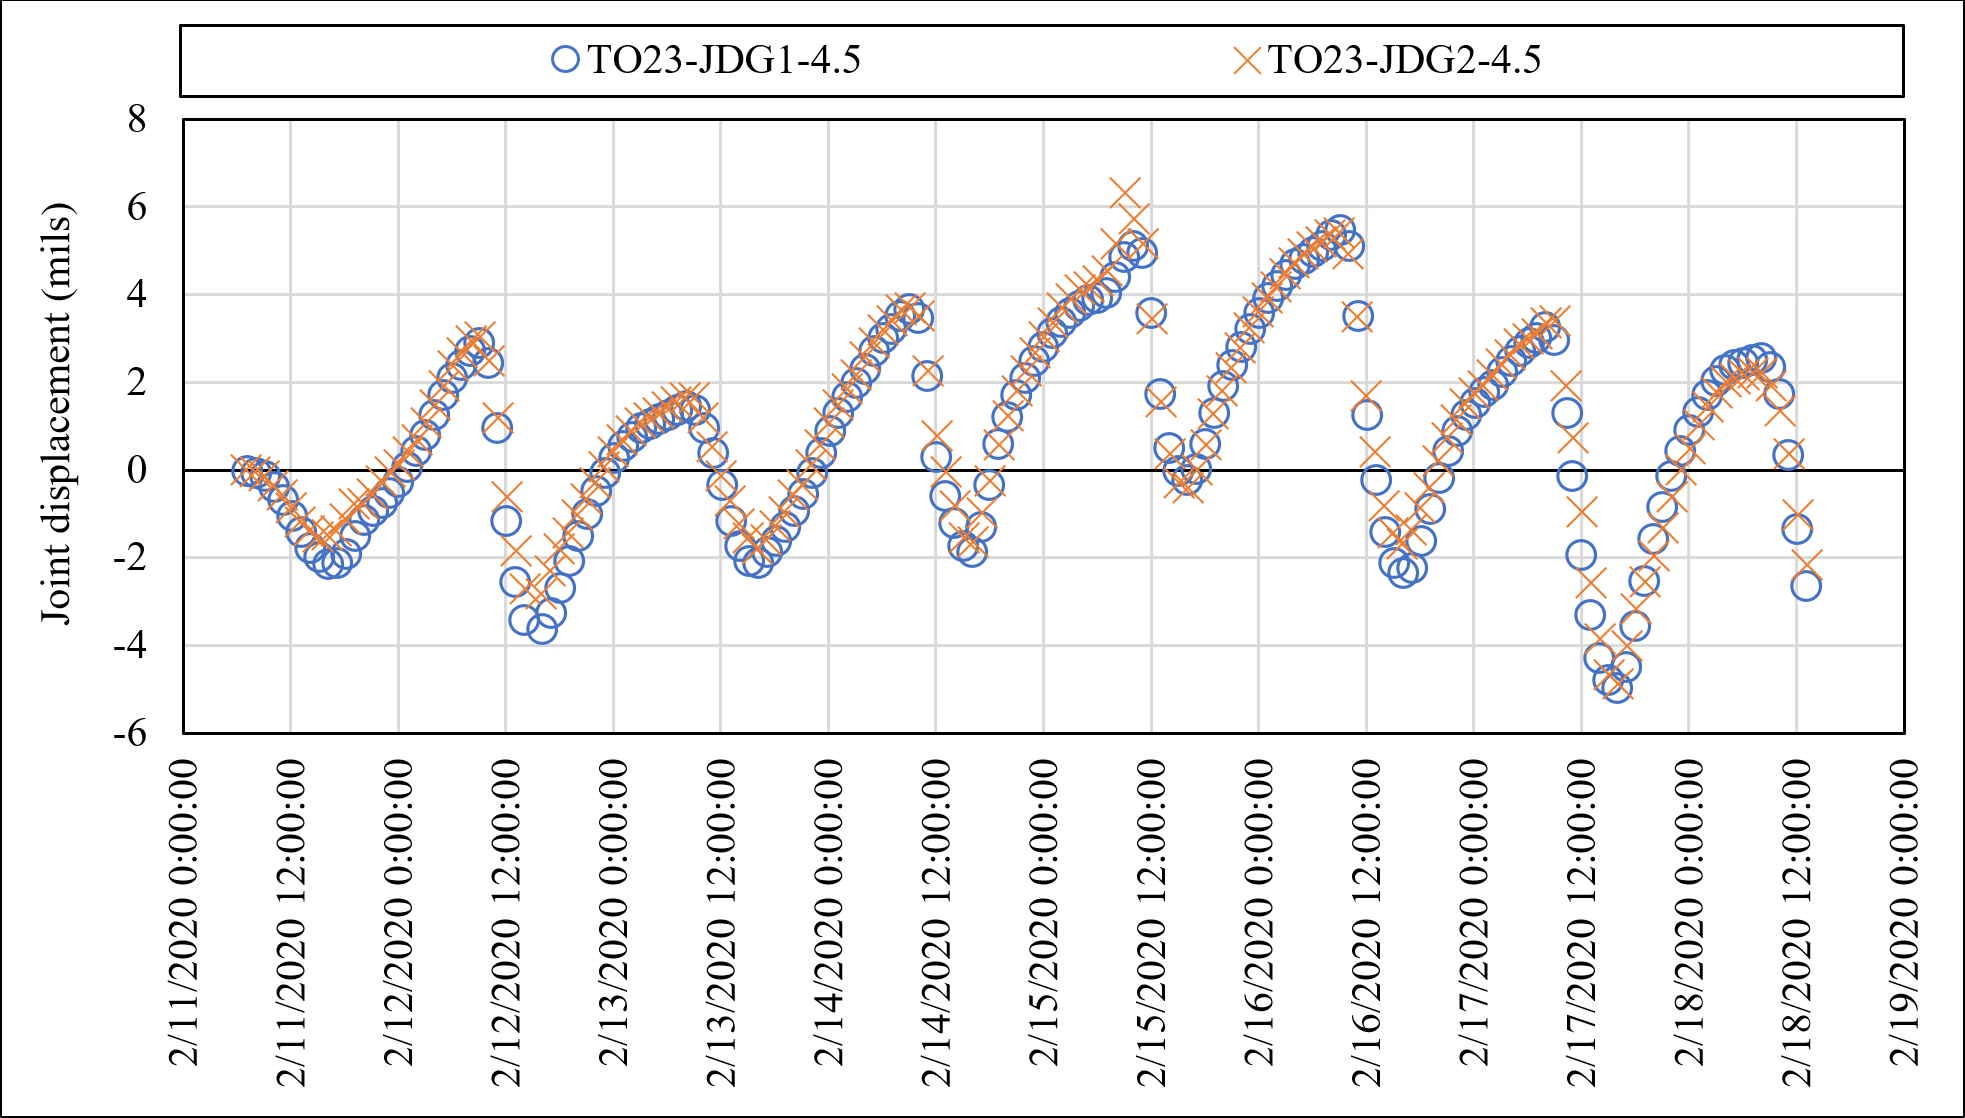
Figure 15. Joint Displacement along Undoweled Joint (over 5-days of Trafficking) (Click to Zoom)
An effort was made to correlate pavement temperature and joint opening/closing. During trafficking, the temperature variation in concrete (P-501MR), as captured by the thermocouple embedded at the mid-depth of PCC slabs, was very small (< 4°F). On the other hand, the range of temperatures in asphalt (P-401MR) layer was larger (> 15°F) due to the exposed overlay edges and the differential of thermal coefficient of contraction and expansion (CTC/E). Figure 16 plots the joint displacement against the temperature change at the bottom of the overlay for both doweled (TO12) and undoweled (TO23) joints. In linear fashion, the PCC joint opened whenever the overlay temperature decreased and vice versa. Regardless of the joint type, the joint opening/closing was governed by both the slab contraction/expansion and the resistance from the overlay material. Thus, the bottom of the overlay underwent temperature-induced tensile stress cycles.
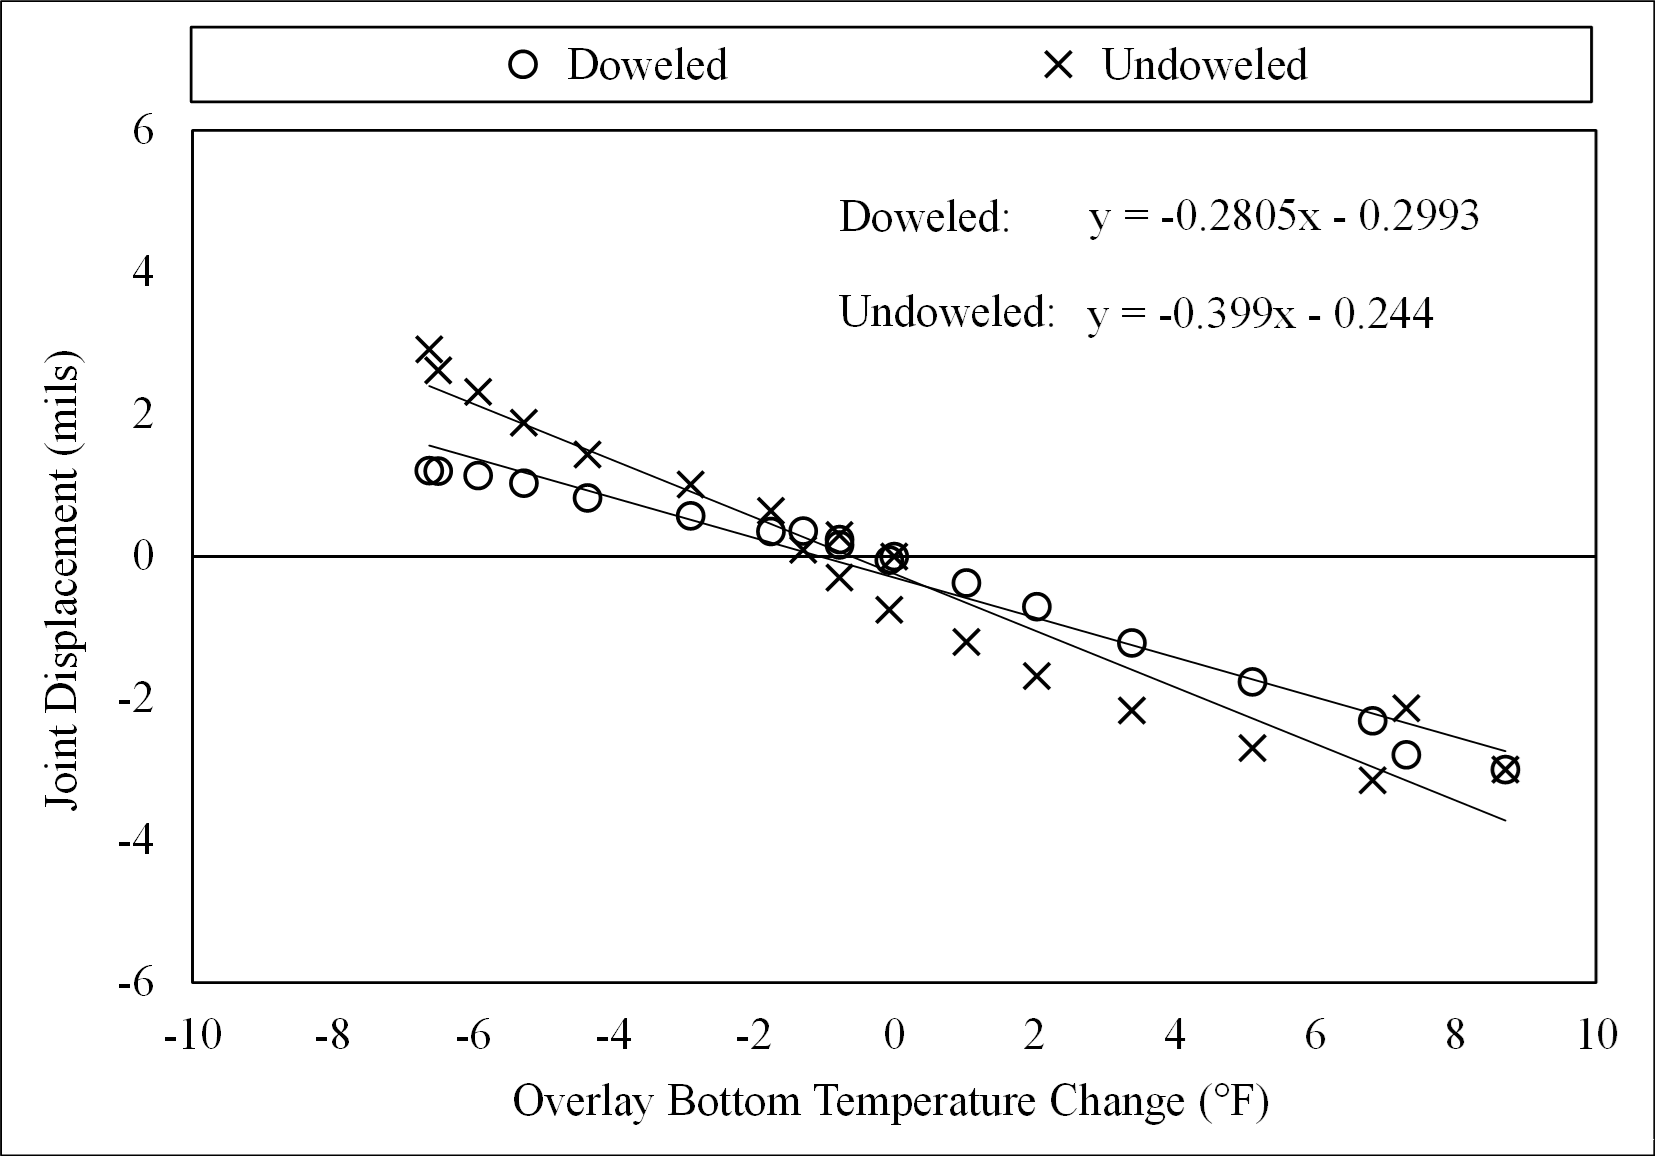
Figure 16. Joint Opening in Response to HMA Temperature Differential (Click to Zoom)
Summary
- By the end of the traffic testing, a total of 2976 cumulative passes were applied to the TT section. Several reflection cracks were observed on the east and west edges along joint TT34, TT45, and TT56.
- The 1st bottom-up reflection crack was observed on the 2nd day of traffic testing (February 12, 2020). The pass number corresponding to crack initiation was identified from strain response, joint displacement, and strain energy analysis.
- On the TO section, the lowest overlay temperature was at the surface. This is opposite to observations from the indoor tests using the NAPTF reflective cracking rig, where a bottom-up cooling scheme was detected.
References
[1] Yin, H. (2016). Long-term Reflective Cracking Test Plan. Federal Aviation Administration., New Jersey, USA, Deliverable 4.3.2
[2] Mandal, T., and Yin, H. (2019). Reflective Cracking Outdoor Phase-1 Construction History Report. Federal Aviation Administration., New Jersey, USA, Deliverable 4.10.1.
[3] General Dynamics Information Technology. (2019). “Reflective Cracking Outdoor Phase I Comprehensive Test Plan,” Federal Aviation Administration., New Jersey, USA, Deliverable 4.3.3.2, Jul. 2019.
[4] ASTM. “Standard Test Method for Airport Pavement Condition Index Surveys,” D5340-12, American Standard for Test and Materials, West Conshohocken, PA, 2012.
[5] Yin, H. (2017). Reflective Cracking Phase V Comprehensive Test Report. Federal Aviation Administration., New Jersey, USA, Deliverable 4.10.5.5.
Return to Reflective Cracking Overview