Trench Field Testing
P-401 Asphalt Mix Layer
- Portable Seismic Property Analyzer (PSPA) tests were performed in both longitudinal and transverse directions. As expected, the seismic moduli of P-401 in traffic areas were generally lower than non-traffic areas in both directions.
- There was no major difference between traffic and non-traffic areas in LFP1-N, because the P-401 layer was thicker than the other test items and the traffic did not introduce much damage in the surface layer.
- Since the seismic wave does not travel through discontinuity and there was significant amount of cracking in test item LFC6-S, PSPA tests were only performed in the traffic area without cracking. The seismic modulus in non-traffic area was found to be close to the traffic area.
- The seismic modulus of P-401 materials reduced due to traffic induced damage.
P-209 Crushed Aggregate Base
- Portable Seismic Property Analyzer for unbound layers (D-PSPA) tests were conducted at offsets -15ft, -10ft, -8ft, and -5ft for test item LFC5-N on the north side, and offsets +5ft, +8ft, +10ft, and +15ft for all test items on the south to determine the seismic moduli of base material. For LFC5-N, the seismic modulus was higher than the average measured values during construction. On the south side, regardless of the D-PSPA orientation (i.e., transverse or longitudinal), the seismic modulus of P-209 material in traffic areas was higher than non-traffic areas. This can be attributed to additional material densification from traffic loads.
- Light Weight Deflectometer (LWD) tests were conducted at offsets -15ft, -10ft, -8ft, and -5ft for test item LFC5-N on the north side, and offsets +5ft, +8ft, +10ft, and +15ft for all test items on the south to determine the modulus of base material. LWD results showed similar trends as PSPA. On the south side, the modulus in traffic areas was higher than non-traffic areas. Post-traffic moduli were higher than the pre-traffic values. Traffic loads increased the density of P-209 material in traffic areas.
- Nuclear gauge density and 12-in sand cone tests were performed on the top of P-209 materials to determine the density and moisture content. The average moisture content of P-209 on the north side was 1.9% (Sand Cone) and 2.4% (Nuclear Density). The average moisture content of P-209 on the south side was 2.1% (Sand Cone) and 2.8% (Nuclear Density). During the construction, sand cone testing yielded an average of 2.7% moisture content. The nuclear density results indicated that traffic loads densified the P-209 materials. The post-traffic density in traffic areas was higher than construction values. Furthermore, the post-traffic density was even higher than the laboratory maximum dry density.
P-154 Aggregate Subbase
- D-PSPA tests were conducted on P-154 surface and additional depths, at offsets -15ft, -10ft, -8ft, -5ft, +5ft, +8ft, +10ft, and +15ft to determine the seismic moduli of the subbase material. The D-PSPA data showed relatively high variations, which prevented evaluation of the modulus difference between surface and deeper layers and between traffic and non-traffic areas.
- LWD tests were conducted at the same locations as D-PSPA. On the north side, there was no significant difference in LWD modulus between P-154 surface and 12 in. below the surface. On the south side, the moduli on P-154 surface was higher than 12 in. below the surface. Generally, the LWD moduli in traffic areas were higher than non-traffic areas.
- Six-in. sand cone tests were performed at the same locations as D-PSPA to determine the in-situ density and moisture content. Nuclear density gauge tests were performed at all offsets marked on the testing location layout. These tests were conducted on the top of P-154 layer as well as at additional depths.
- The average moisture content measured by sand cone tests was 2.2%. The average moisture content determined by nuclear density tests was 3.9%. Sand cone testing performed during construction yielded an average moisture content of 4.1%. In test items LFC5-N and LFS6-N, the density at the top of the P-154 layer was higher than 12 in. below the top. On the south side, the density at the top of the P-154 layer was higher than 10 in. below the top. Also, the density in the traffic areas was higher than non-traffic areas.
P-152 Dupont Clay Subgrade
- D-PSPA tests were conducted at offsets -15ft, -10ft, -8ft, -5ft, +5ft, +8ft, +10ft, and +15ft on the top of P-152 to determine the seismic moduli of subgrade material. There was no significant difference between traffic and non-traffic areas. The mean value of post-traffic data was similar to the pre-traffic data.
- LWD tests were performed at the same locations as D-PSPA. There was no significant difference between traffic and non-traffic areas. On the north side, the post-traffic LWD moduli were higher than the pre-traffic average values. On the south side, the post-traffic LWD moduli were close to the pre-traffic values.
- CBR and vane shear tests were performed at the same locations as LWD tests. Most post-traffic CBR values were lower than the pre-traffic values. This is possibly a result of additional water that seeped by gravity during the construction of P-154 and P-209 layers. The CBR and Vane Shear values in the traffic area were slightly higher than non-traffic area.
- Drive Cylinder and Nuclear Density tests were performed at CBR locations to measure the dry density and moisture content. The average moisture content in test items LFC5-N and LFS6-N was 27.4% which was higher than pre-traffic test value of 26.2%. For test items LFP1-N, LFP2-N, LFP3-N and LFP4-N the average moisture content was 34.5%. This average value was also higher than the construction moisture content of 33.6%. On the south side, the post-traffic moisture content was 27.4% whereas the pre-traffic moisture content was 26.6%. In general, the post-traffic moisture content was approximately 1% higher than pre-traffic values.
- There was no significant difference in density between traffic and non-traffic areas. The difference between post-traffic and pre-traffic density values were also negligible.
- Dynamic Cone Penetrometer (DCP) tests were performed at the CBR test locations to measure the strength of compacted subgrade material. CBR values were estimated using DCP index. These estimated CBR values increased with depth from 2% to 14% on the north side and from 2% to 23% on the south side.
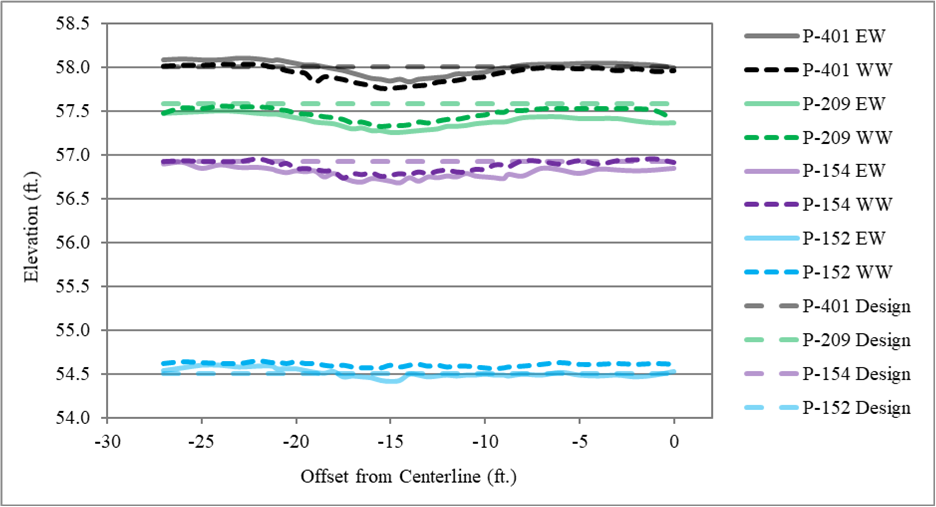
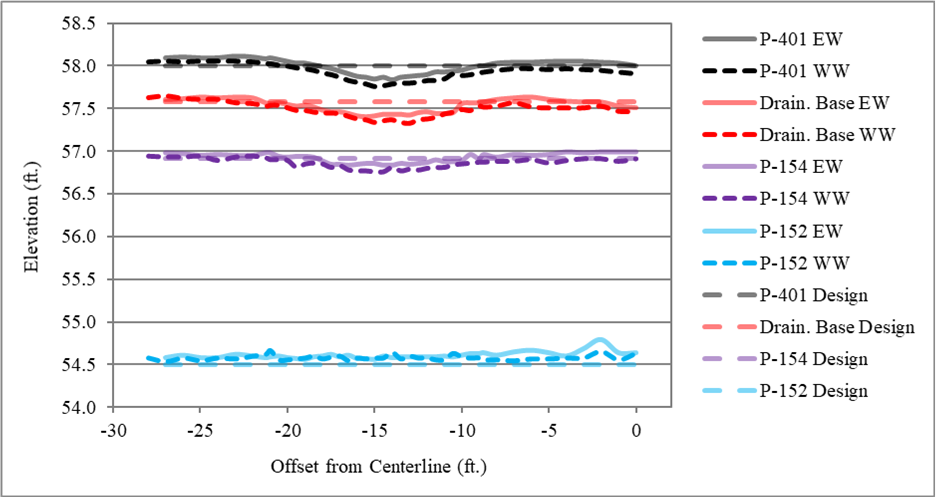
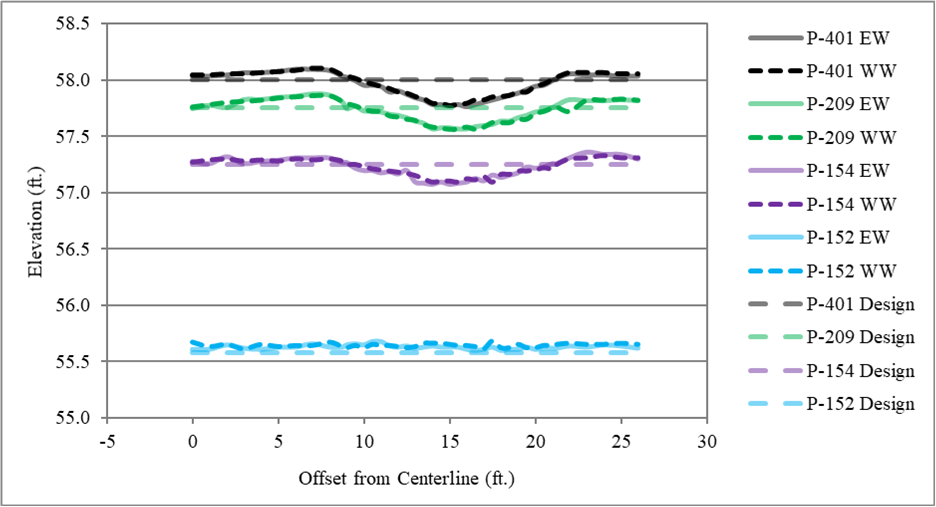
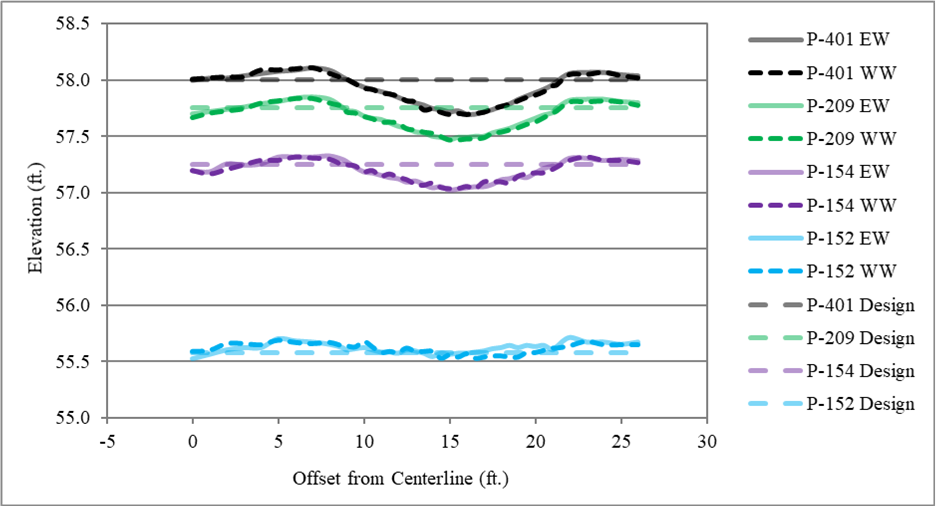
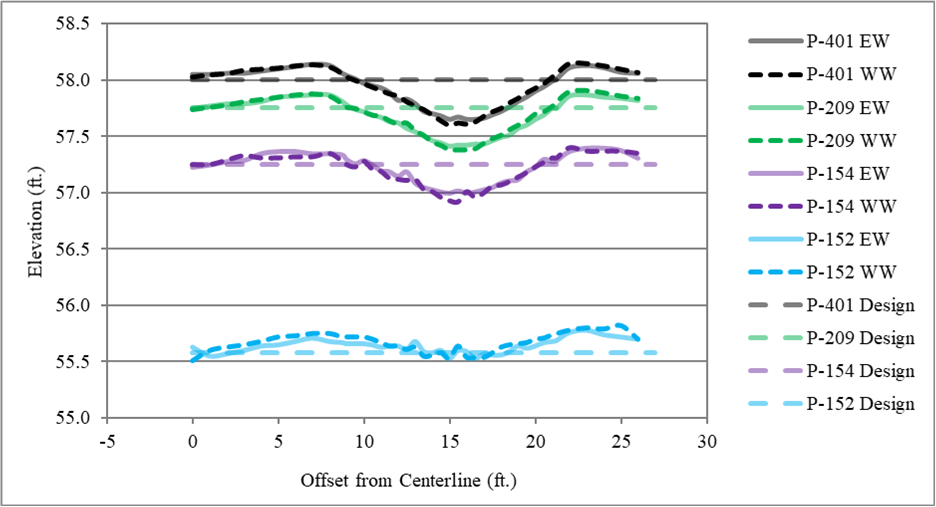
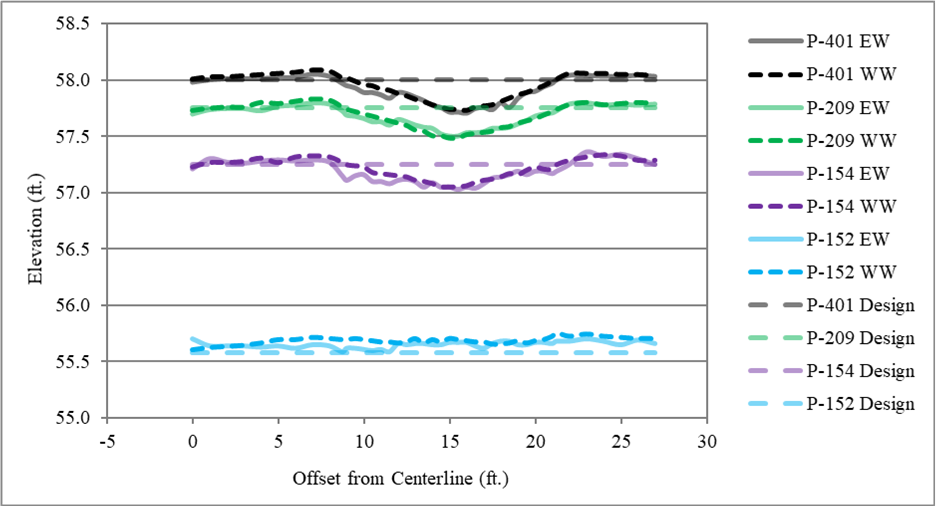
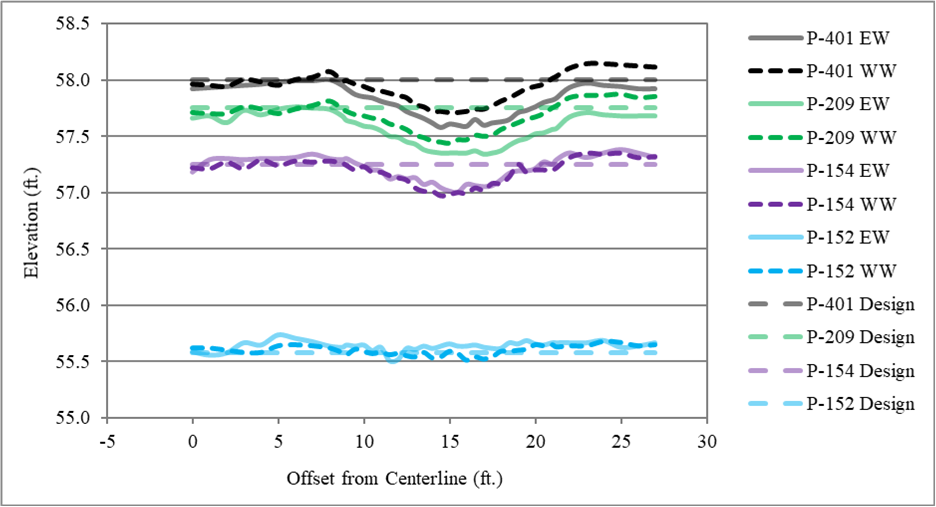
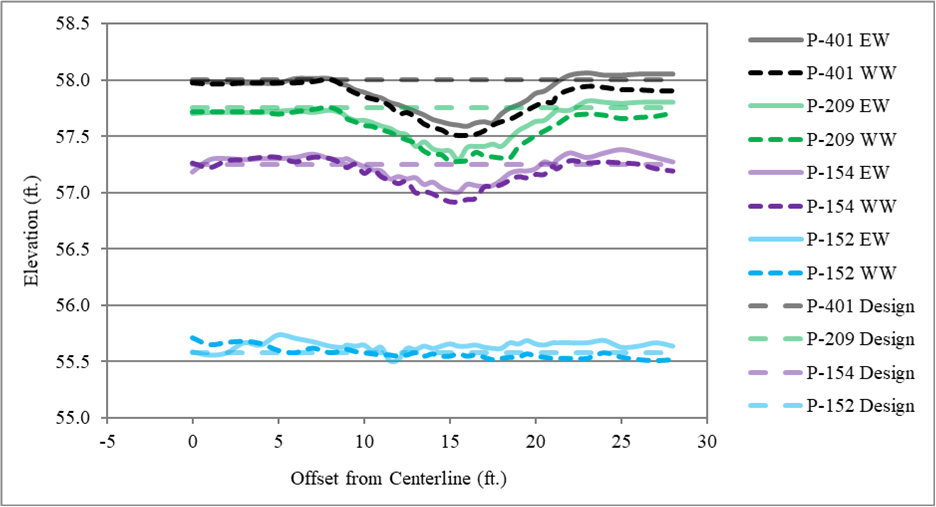
Layer Profile
- Once field tests were completed, trench walls were cleaned to expose layer interface. Using a laser straight line, the face of each trench was measured to get layer profiles. These profiles for test items on the north and south side are provided in the figures below.
- Layer profiles showed that for all test items the majority of observed rutting was contributed by P-154 subbase. The reduction of P-154 layer thickness contributed 70% to 100% of the total rutting.
- P-154 layer thickness reduction in test item LFC5-N was higher than LFS6-N. Under the same traffic loads, the vertical stress at P-154 surface in LFC5-N was higher than LFS6-N. ATDB material may distribute the traffic loads more effectively than P-209 material.
For detailed results, click here to download the CC7 Post-Traffic Report – Field Testing.
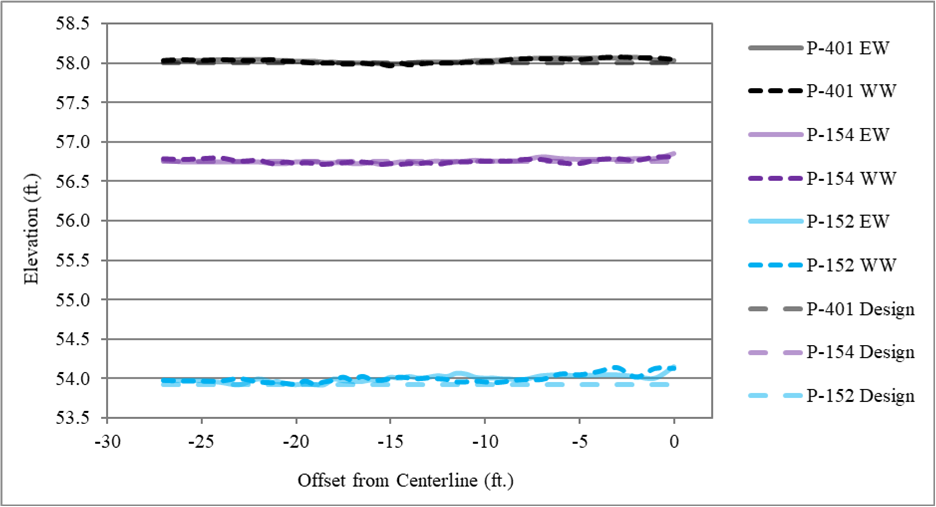
Pavement Layer Profiles, LFP1-N (Click to Zoom)
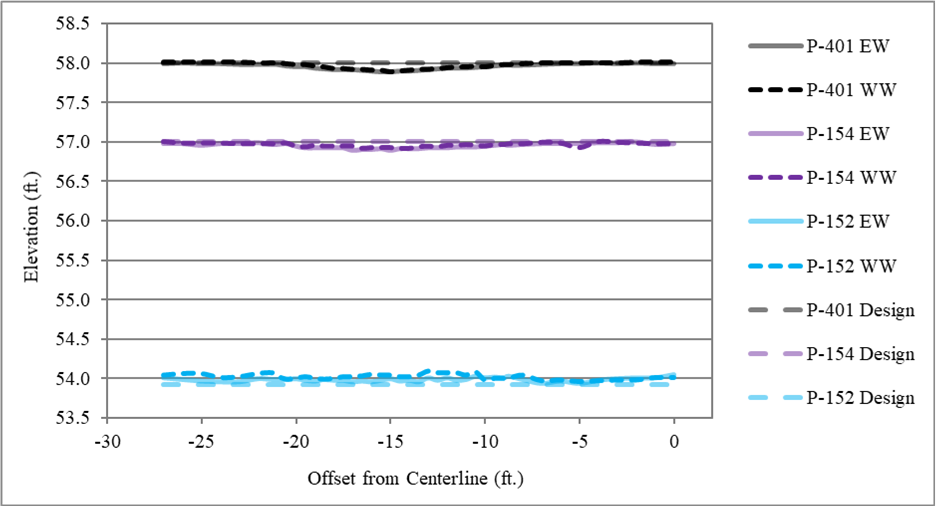
Pavement Layer Profiles, LFP2-N (Click to Zoom)
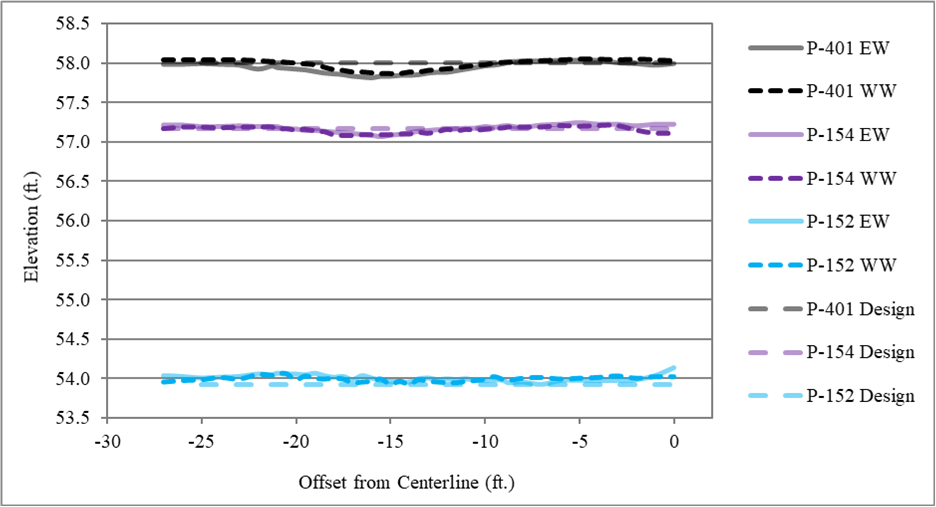
Pavement Layer Profiles, LFP3-N (Click to Zoom)
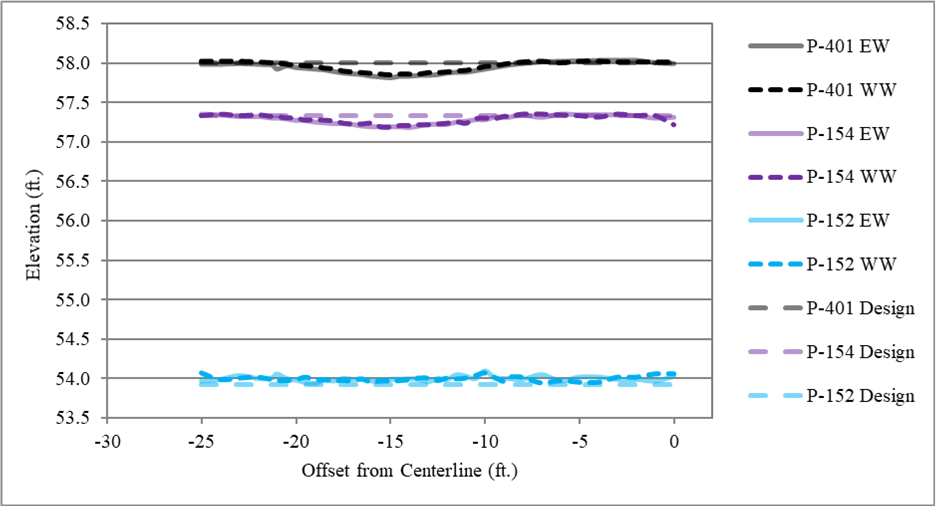
Pavement Layer Profiles, LFP4-N (Click to Zoom)
Pavement Layer Profiles, LFC5-N (Click to Zoom)
Pavement Layer Profiles, LFS6-N (Click to Zoom)
Pavement Layer Profiles, LFC1-S (Click to Zoom)
Pavement Layer Profiles, LFC2-S (Click to Zoom)
Pavement Layer Profiles, LFC3-S (Click to Zoom)
Pavement Layer Profiles, LFC4-S (Click to Zoom)
Pavement Layer Profiles, LFC5-S (Click to Zoom)
Pavement Layer Profiles, LFC6-S (Click to Zoom)
Return to Construction Cycle 7 Overview