CC8 Phase 4 Strength & Fatigue Outer Lanes Traffic Test Results & Analysis
Objective
Phase 4 of CC8 was aimed at determining the cracking strength and fatigue life of concrete slabs designed and built to FAA standards; hence, this phase was designated the Strength/Fatigue test. The primary objective of the CC8 Strength/Fatigue test was to isolate the three phases of the bottom-up cracking mechanism as shown below, and estimate the fatigue life contribution of all three stages:
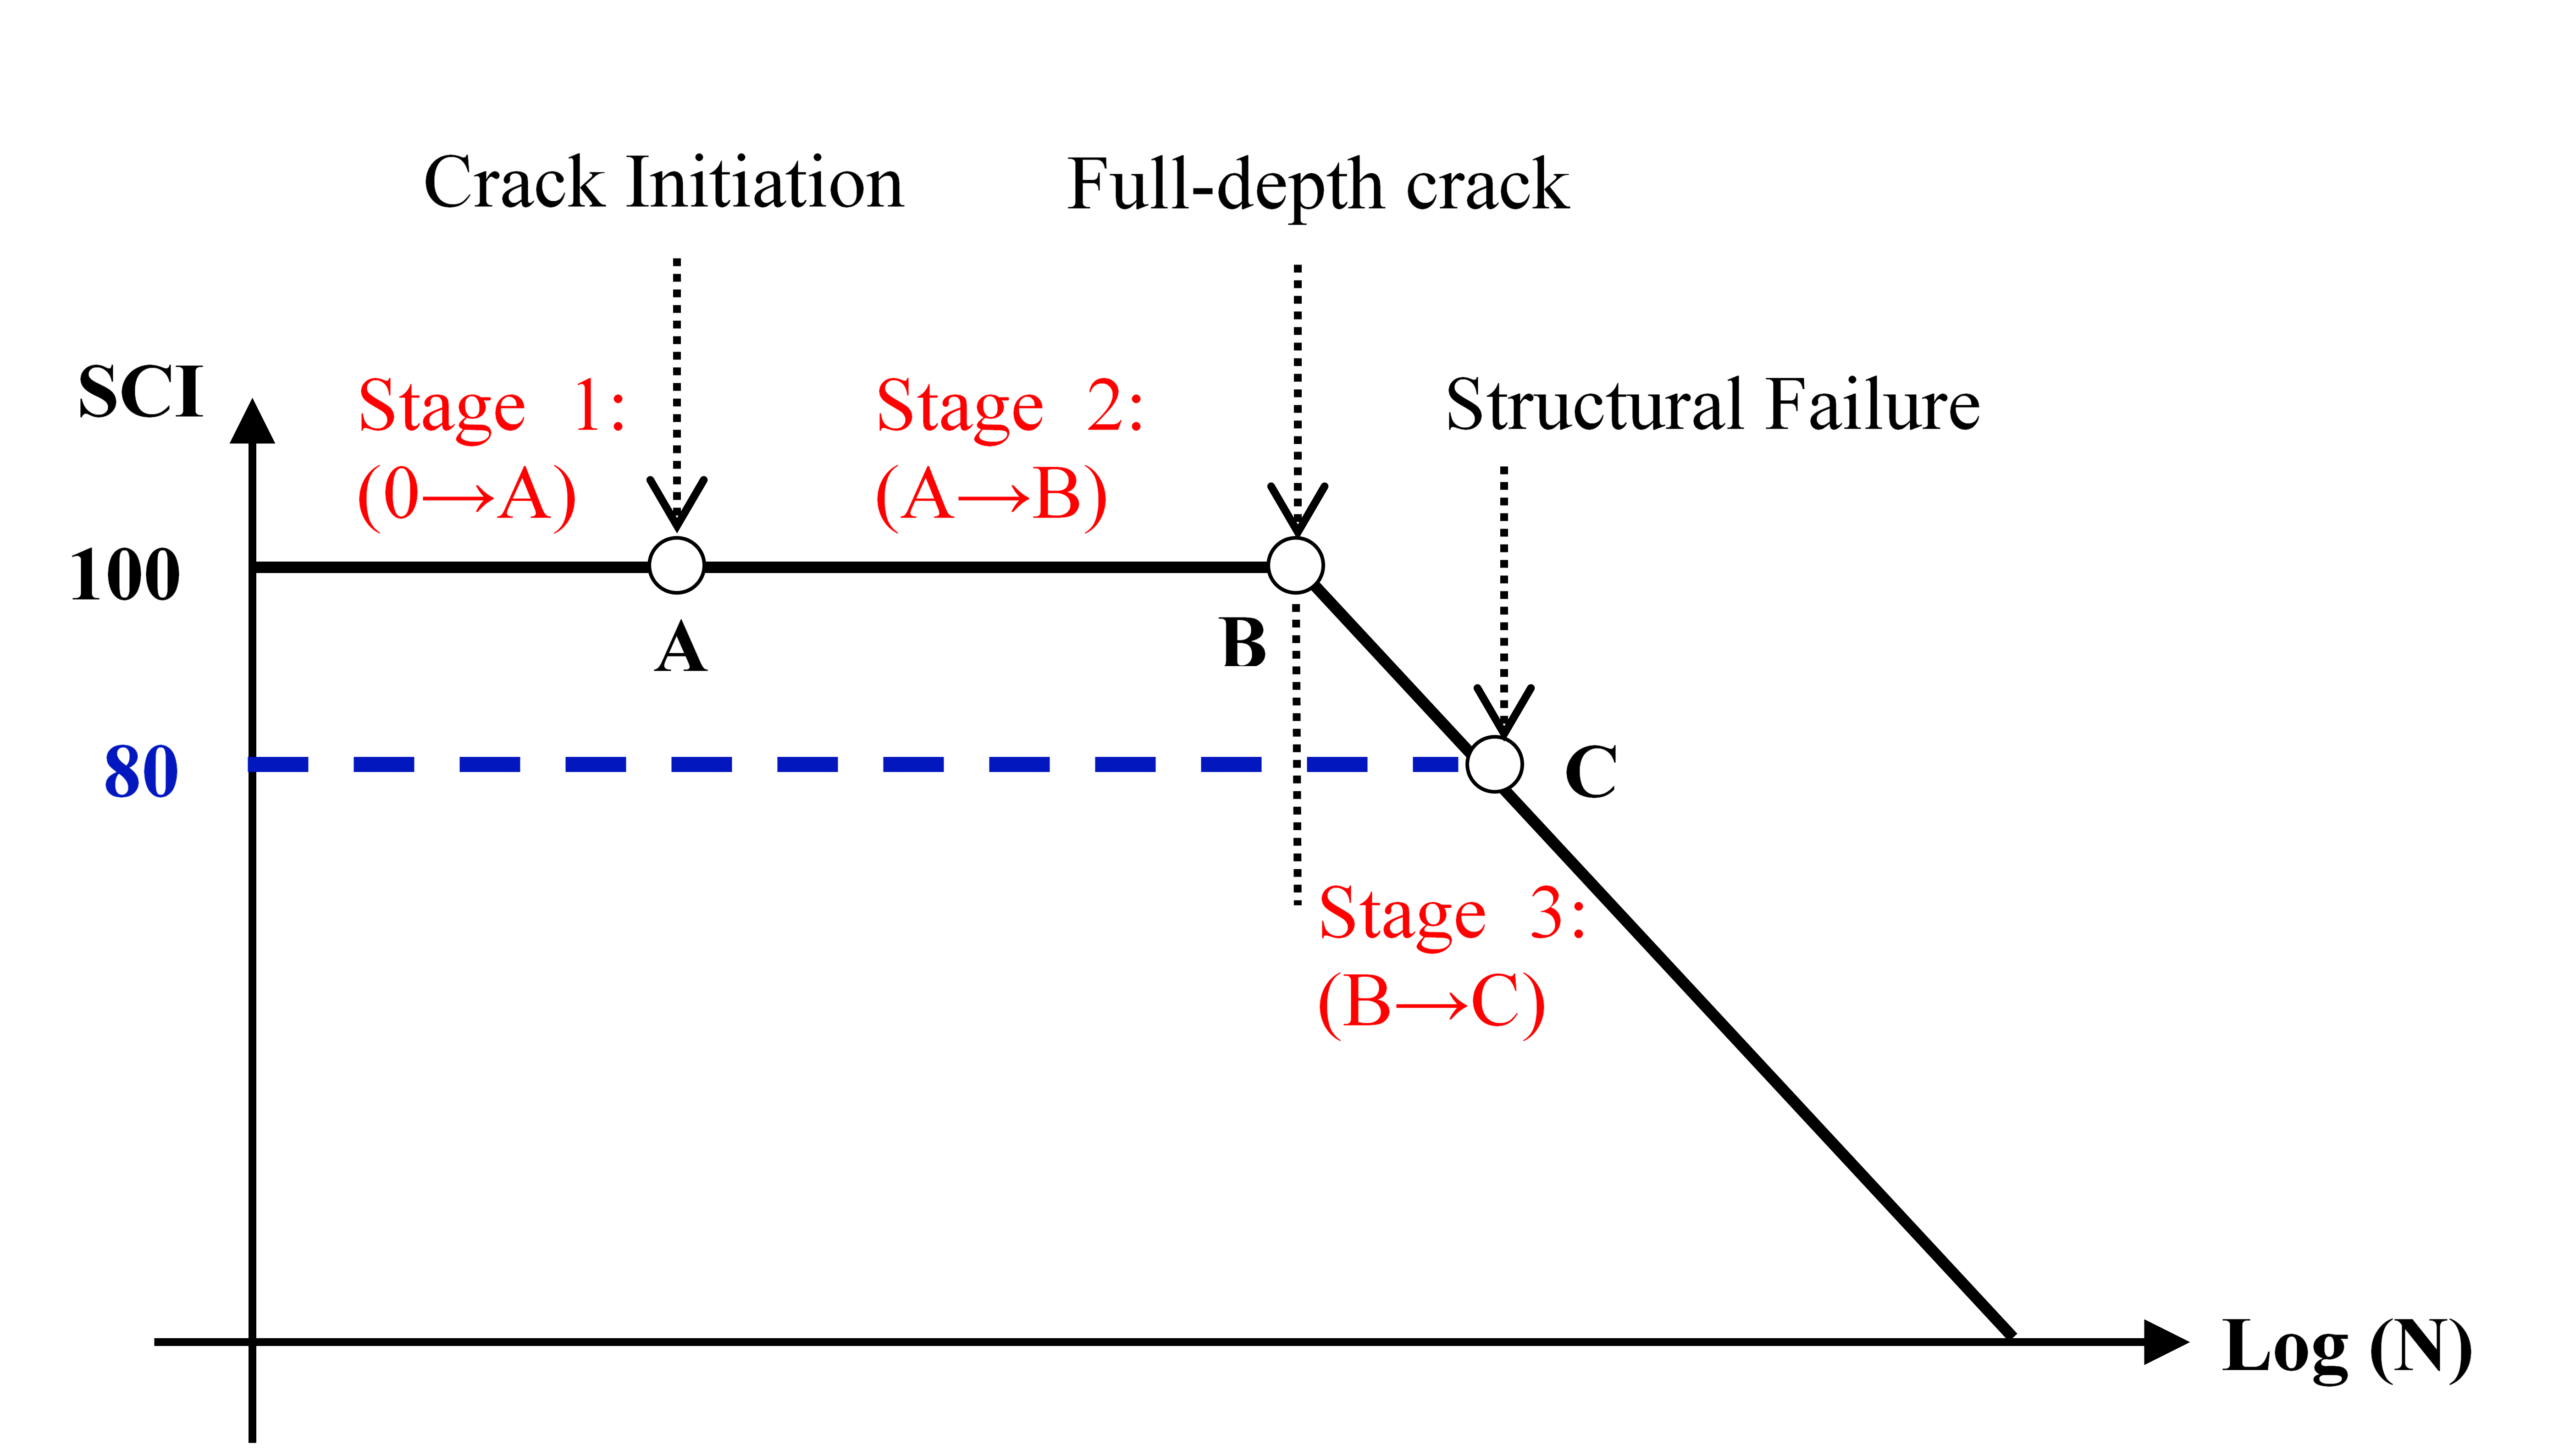
Rigid Pavement Failure Model in FAARFIELD (Reproduced from Guo et al. 2008) (Click to Zoom)
Full-scale tests were designed to obtain data from individual slabs regarding: (1) slab cracking strength for comparison to ASTM C78; (2) bottom-up crack propagation in notched slabs; (3) crack initiation and propagation in unnotched slabs; and (4) the trade-off between concrete strength and slab thickness as both factors affect fatigue life. In addition, the effect of subgrade strength was considered by including two CBR values, low-strength (CBR 3-4) and medium-strength (CBR 7-8).
Traffic Test Results
Full-scale tests on the outer lanes were conducted in two phases: static and moving load tests. In the north outer lane, static load tests initiated bottom-up cracks (Stage 1). Then moving load tests propagated the crack to the surface (Stages 2 and 3). In the south outer lane, static load tests were not conducted; moving wheel loads both initiated bottom-up cracks and propagated the cracks to the surface (Stages 1-3).
Static Load Test (North)
During the static load tests, strain gage data on crack initiation were collected over a two-day period, August 21-22, 2018. The data below were obtained in a static load test to initiate a bottom-up crack in slab SF9N, north outer lane. The NAPTV single-wheel module was positioned as described and illustrated in the Wander Pattern/Static Load section here. The initial wheel load of 5,000 lbs was applied, held for approximately 10s, and then released. The wheel load was then increased in 2,500 lbs increments and the procedure repeated until EG-N-SF-II-10 response indicated a rupture at the slab bottom. As shown in the figure, the relationship between recorded strain and applied load was approximately linear at low load levels but turned highly nonlinear after a crack formed at 130,000 lbs. The table below summarizes cracking loads and associated strains from the static load tests.
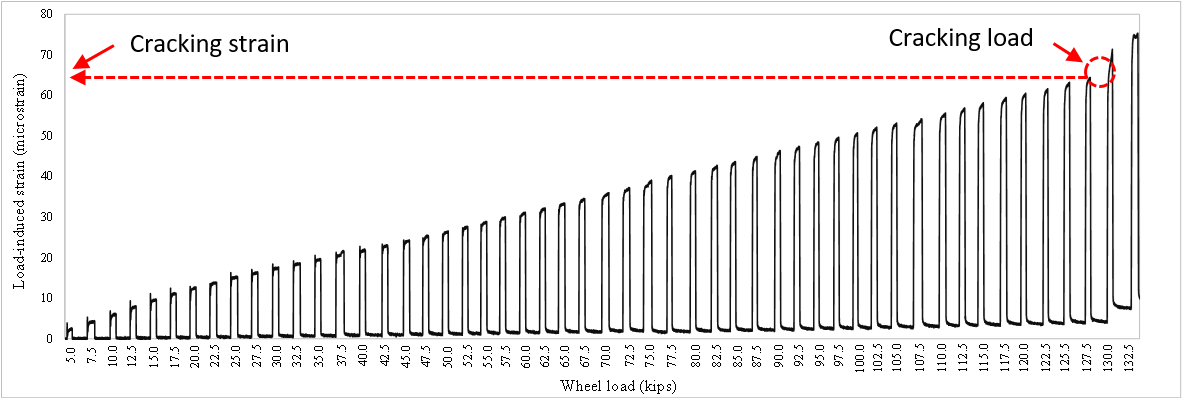
Example of Static Load Test on the North Outer Lane, Slab SF9N - Strain vs. Load (Click to Zoom)
Summary of Static Load Test Results
|
Slab ID
|
Thickness (inch)
|
R-value (psi)
|
Cracking Load (lbs)
|
Cracking Strain (microstrain)
|
|
SF9N
|
12
|
650
|
130,000
|
63
|
|
SF10N
|
100,000
|
53
|
|
SF11N
|
112,500
|
76
|
|
SF12N
|
77,500
|
51
|
|
SF13N
|
9
|
900
|
87,500
|
85
|
|
SF14N
|
75,000
|
85
|
|
SF15N
|
67,500
|
76
|
|
SF16N
|
87,500
|
77
|
Moving Load Test (North and South)
After completing the static load tests on the north outer slabs, the next step was to apply moving wheel loads to both outer lanes. For precracked slabs SF9N-SF16N (north outer lane), the repeated passes of the moving wheel load propagated the initiated crack to the surface. For non-precracked slabs SF9S-SF16S (south outer lane), crack initiation was first achieved “naturally” by the moving gear load and then followed by the crack propagation phase.
Moving-load traffic tests on the outer lanes began on August 27, 2018. Traffic loads were applied with zero wander, that is, along a single track. Traffic was applied simultaneously on the north and south outer lanes using the NAPTV single-wheel (S) modules, at a nominal tire pressure of 220 psi. The traffic loads (set at 80% of the average cracking loads from the static tests) were 84,000 lbs on 12 inch-thick slabs, reduced to 63,500 lbs on 9 inch-thick slabs. At the conclusion of outer lane traffic testing on October 3, 2019, the cumulative pass numbers were 30,292 on the north and 49,930 on the south. As expected, the pass counts on the north side were much smaller because of the pre-cracked condition. Full-length surface cracks eventually developed on all slabs except SF11S. This slab will be further investigated in post-traffic forensic tests.
Behavior of Test Section Under Traffic
Distress Mapping
Longitudinal cracking was the dominant distress type, as expected due to the zero-wander traffic. Surface distresses were observed on the north slabs earlier than the south side. This was the anticipated result of bottom-up cracking initiated in the north outer lane during static load tests. On some slabs, secondary diagonal cracks were observed following full-length propagation of longitudinal cracks.
Trafficking on the north outer lane ended at 30,292 total vehicle passes on May 14, 2019. At that point, all slabs had a full-length longitudinal crack. All outer lane slabs on the south side except SF11S achieved full-length crack propagation by July 5, 2019. Since no sign of surface distress on slab SF11S was observed after 49,930 vehicle passes, trafficking on the south outer lane was terminated on October 3, 2019. The figures below show the final distress maps at the completion of traffic testing for slab groups 1-4 and 5-8, respectively.
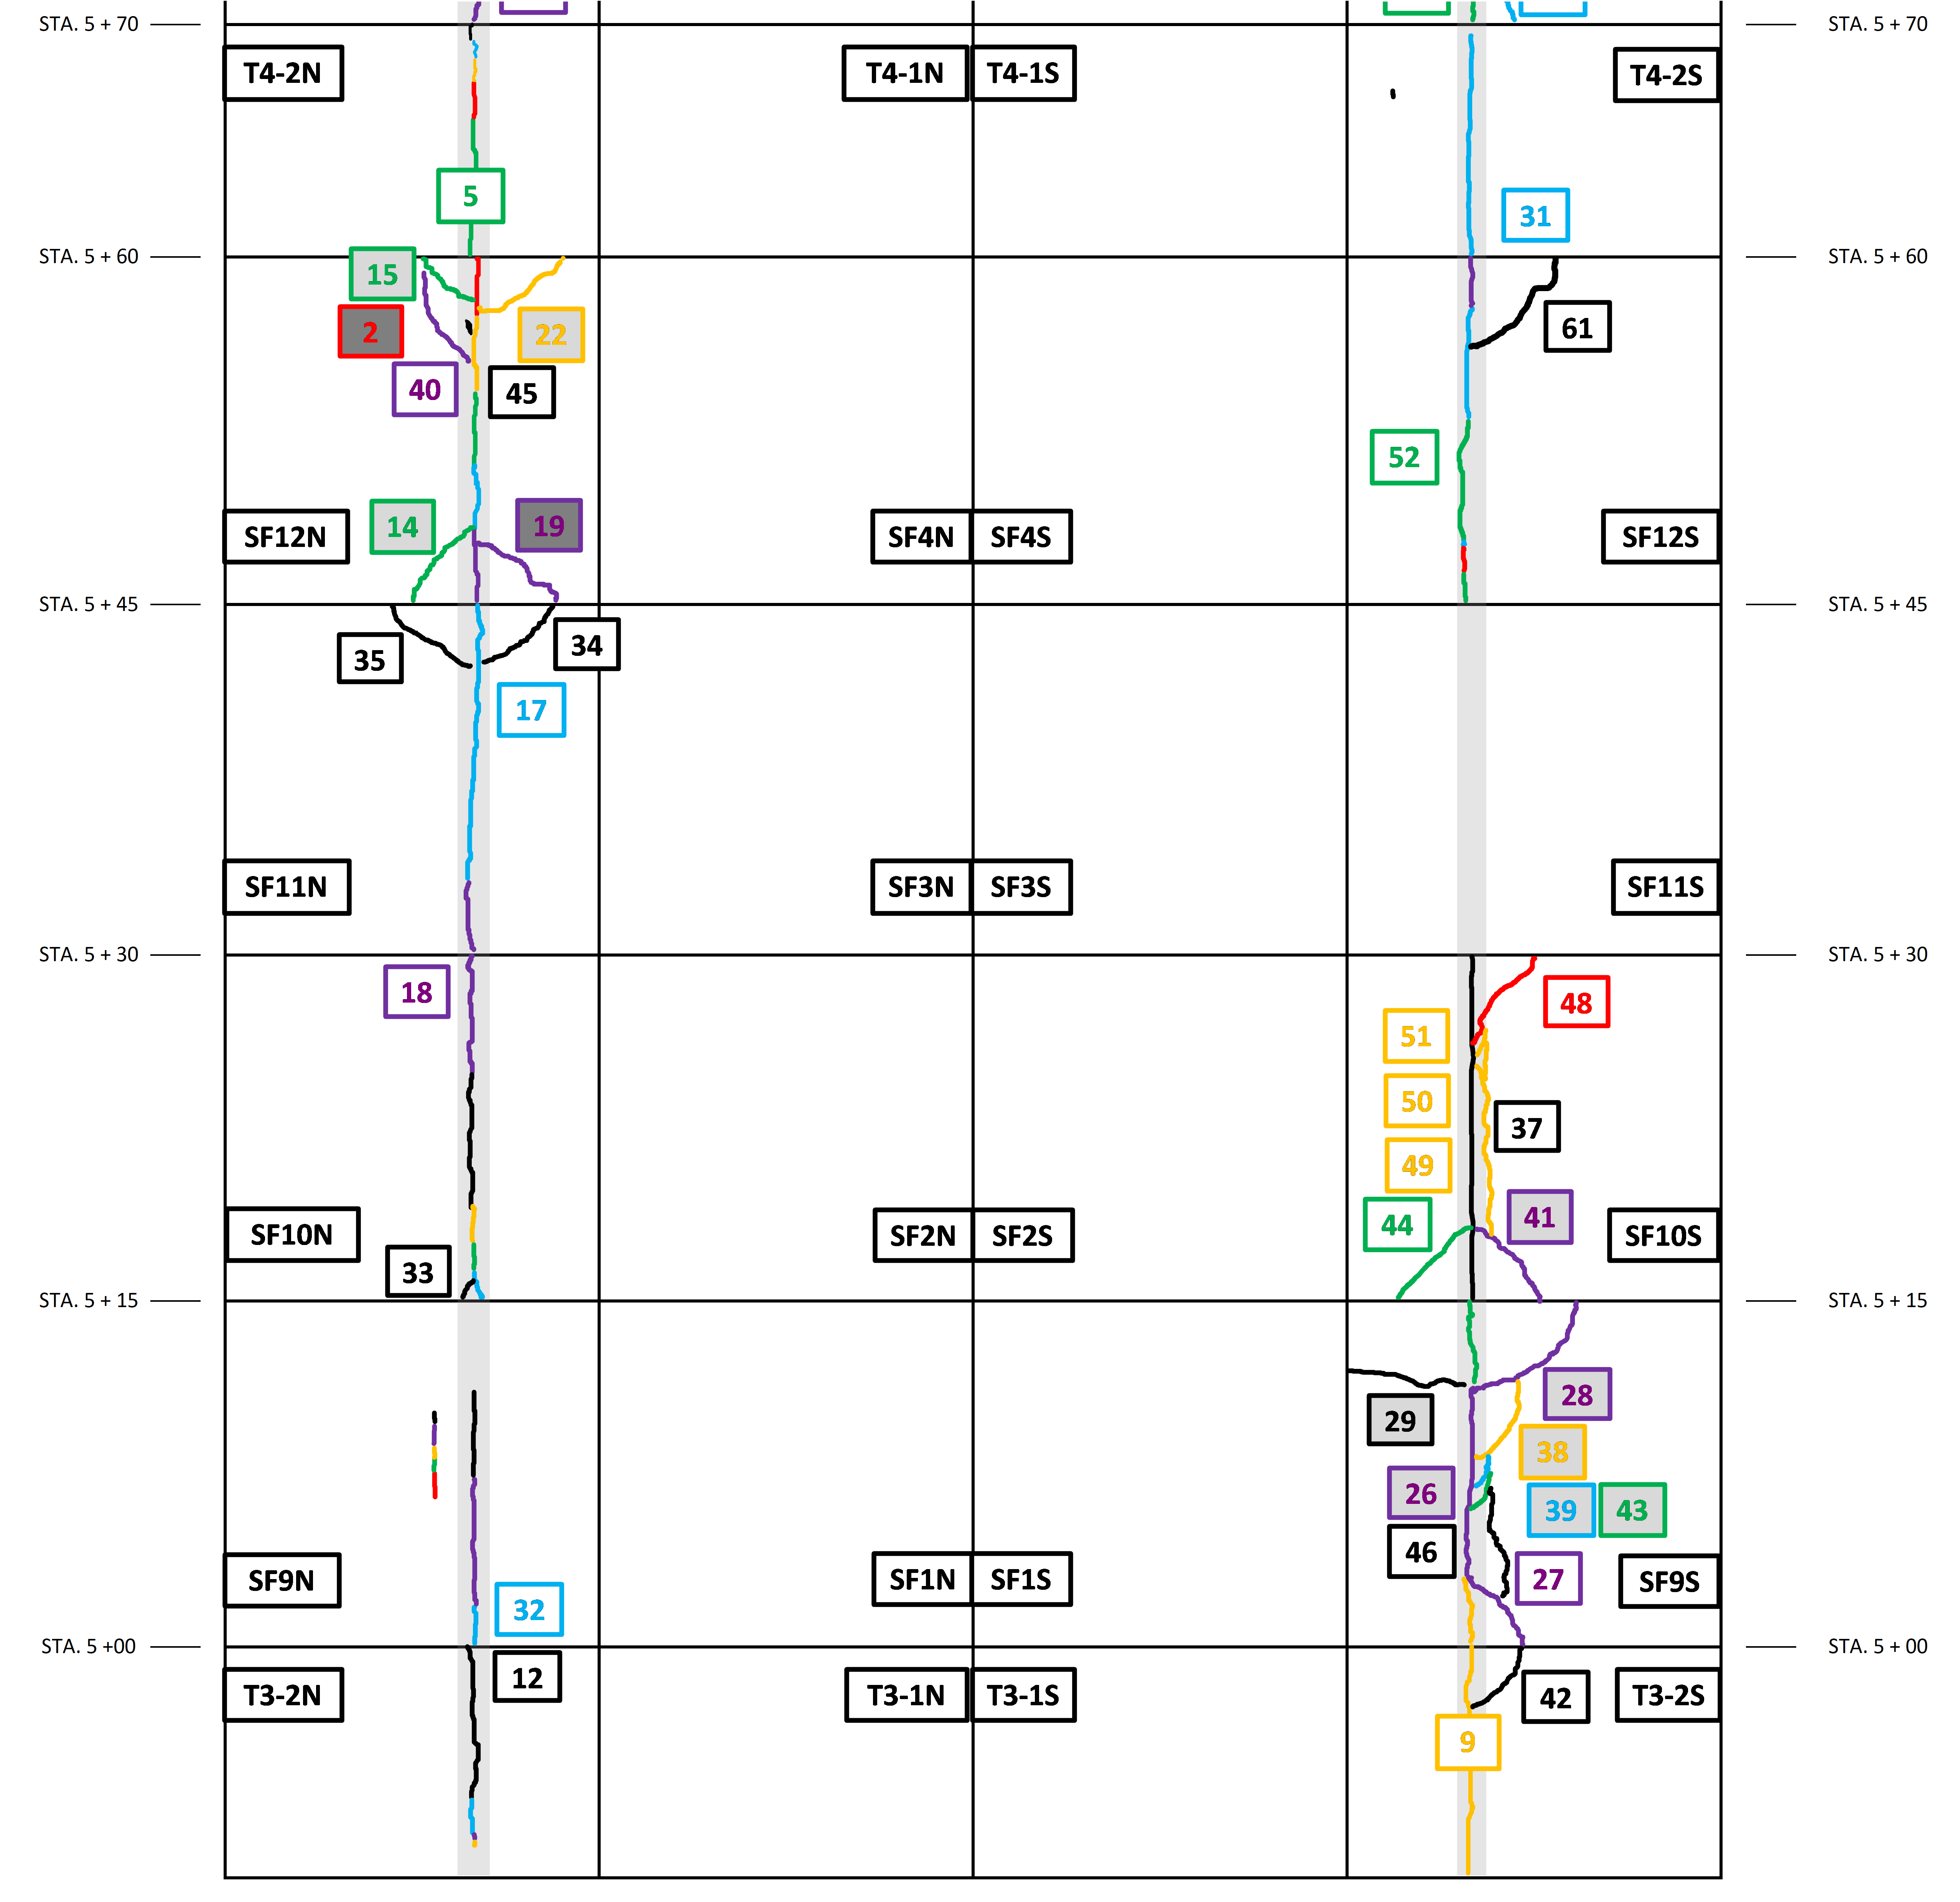
Final Distress Map after Traffic Test on the Outer Lanes (Groups 1-4) (Click to Zoom)
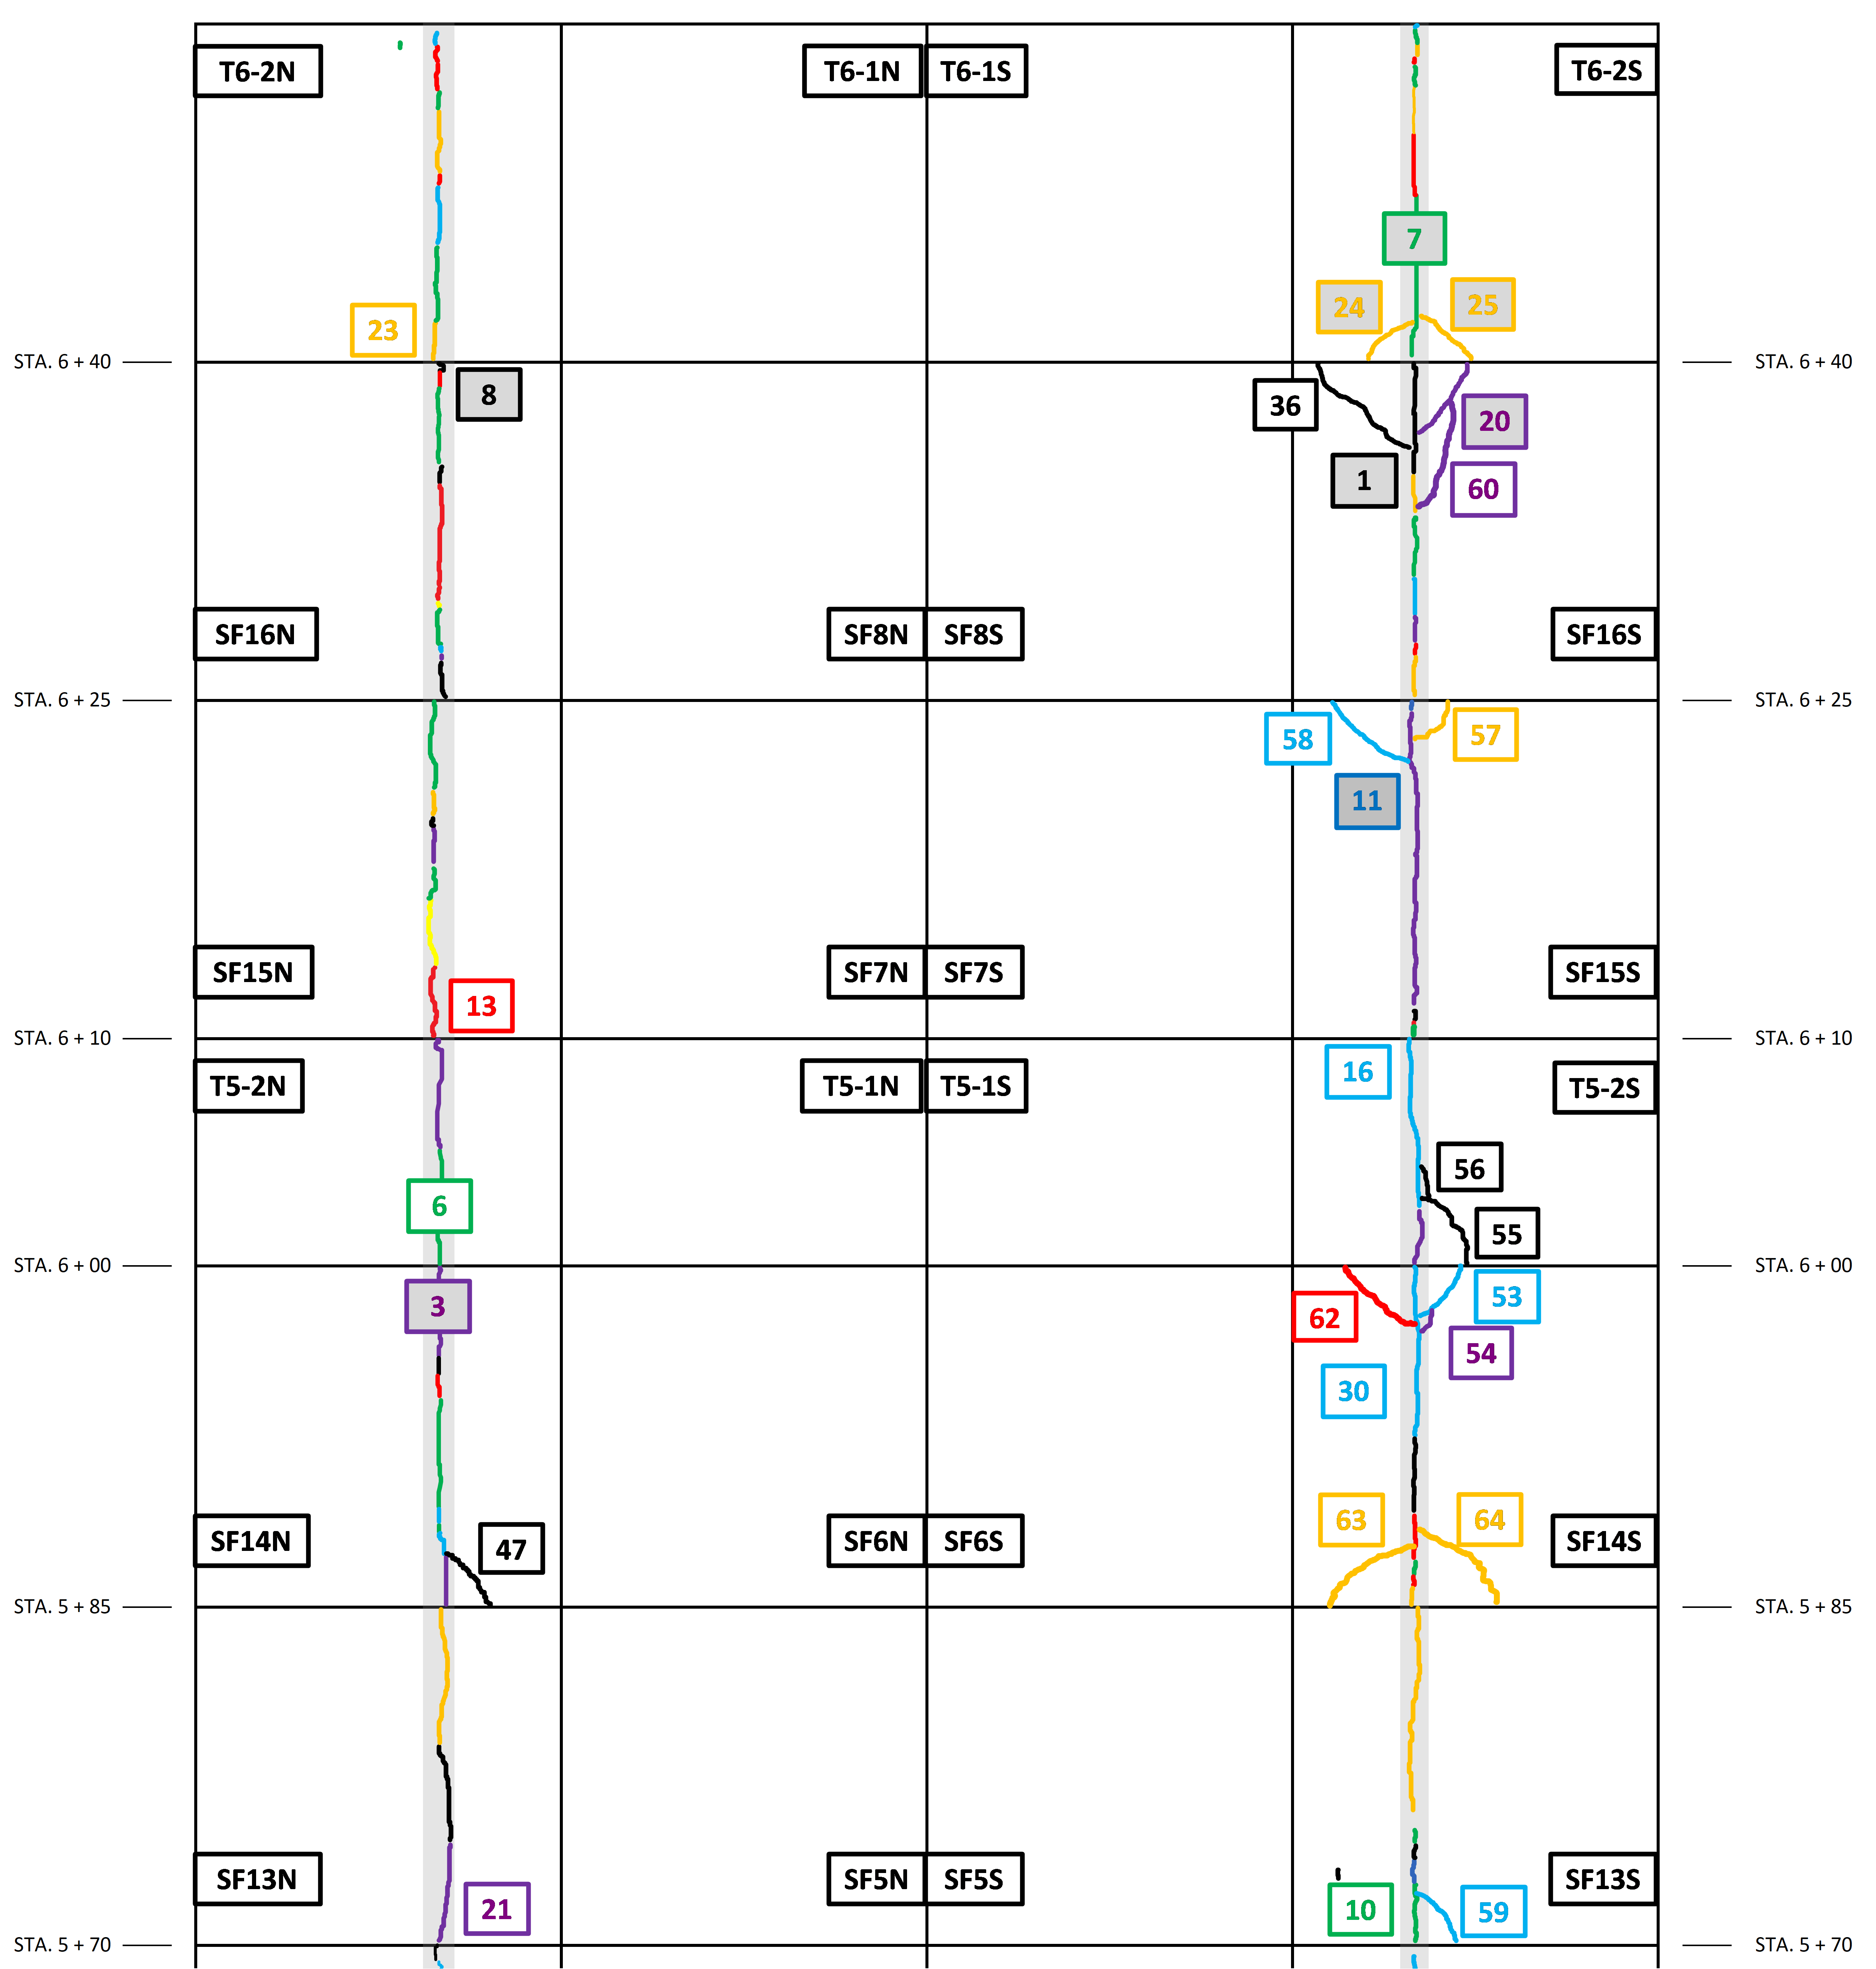
Final Distress Map after Traffic Test on the Outer Lanes (Groups 5-8) (Click to Zoom)
Characterization of Crack Propagation
Crack development at the surface was recorded by daily distress surveys. Cumulative passes corresponding to the first appearance of bottom-up cracks and full-length propagation of longitudinal cracks (i.e., crack connects both west and east end of the slab) are summarized in the table below. In general, longitudinal cracks were observed on the north outer lane earlier than the south. On the south side, both first appearance and full-length crack propagation on SF9S and SF10S were recorded on the same day, most likely because of uninterrupted daily trafficking. At the completion of traffic testing no surface distress was observed on SF11S. The cumulative passes corresponding to each stage of fatigue life are also summarized in the following table.
Summary of Crack Characterization
The table below shows estimates of coverages to failure based on the CC8 Strength/Fatigue performance data. For each combination of slab thickness and subgrade strength, the number of coverages in the last column corresponds to a 50% probability of a completed full-length longitudinal crack.
Estimate of Coverages for Completion of Longitudinal Crack (CC8 Strength/Fatigue Test)
|
Test Item
|
Group
|
Slab ID
|
Thickness (inch)
|
R-value (psi)
|
Cumulative Passes To
|
|
Full-length Propagation
|
50% Failure Probability (median)
|
|
North
|
1
|
SF9N
|
12
|
650
|
30292
|
18322
|
|
SF10N
|
19584
|
|
3
|
SF11N
|
17060
|
|
SF12N
|
7269
|
|
5
|
SF13N
|
9
|
900
|
18536
|
18012
|
|
SF14N
|
11430
|
|
7
|
SF15N
|
19060
|
|
SF16N
|
17488
|
|
South
|
2
|
SF9S
|
12
|
650
|
20084
|
22922
|
|
SF10S
|
22922
|
|
4
|
SF11S1
|
-
|
|
SF12S
|
42480
|
|
6
|
SF13S
|
9
|
900
|
21626
|
18725
|
|
SF14S
|
27160
|
|
8
|
SF15S
|
15824
|
|
SF16S
|
9349
|
1 No surface distresses were observed on SF11S
|
Test Item
|
Group
|
Slab ID
|
Thickness (inch)
|
R-value (psi)
|
First Crack Appearance
|
Full-length Propagation
|
|
Location
|
Cumulative Passes
|
Average
|
Location
|
Cumulative Passes
|
Average
|
|
North
|
1
|
SF9N
|
12
|
650
|
West End
|
22922
|
15528
|
East End
|
30292
|
18551
|
|
SF10N
|
East End
|
17060
|
West End
|
19584
|
|
3
|
SF11N
|
East End2
|
16586
|
West End
|
17060
|
|
SF12N
|
East End
|
5543
|
West End
|
7269
|
|
5
|
SF13N
|
9
|
900
|
West End
|
17060
|
12771
|
East End
|
18536
|
16629
|
|
SF14N
|
East End
|
7269
|
West End
|
11430
|
|
7
|
SF15N
|
West End
|
14806
|
East End
|
19060
|
|
SF16N
|
East End
|
11949
|
West End
|
17488
|
|
South
|
2
|
SF9S1
|
12
|
650
|
-
|
20084
|
27359
|
-
|
20084
|
28495
|
|
SF10S1
|
-
|
22922
|
-
|
22922
|
|
4
|
SF11S3
|
-
|
-
|
-
|
-
|
|
SF12S
|
Mid-slab
|
39072
|
Both Ends
|
42480
|
|
6
|
SF13S
|
9
|
900
|
West End
|
12858
|
13608
|
East End
|
21626
|
18490
|
|
SF14S
|
East End
|
22922
|
West End
|
27160
|
|
8
|
SF15S
|
East End2
|
13382
|
West End
|
15824
|
|
SF16S
|
East End
|
5269
|
West End
|
9349
|
1 Location of first crack appearance unknown
2 Slab end instrumented with EG
3 No surface distresses were observed on SF11S
Cumulative Passes Allocated to Each Stage of the Failure Model in Figure 1 (Based on Averages of 4-Slab Groups)
|
Test Item
|
Group
|
Slab ID
|
Thickness (inch)
|
R-value (psi)
|
Average Cumulative Passes
|
|
Stage 1
|
Stage 2
|
Stage 1+2
|
Stage 3
|
Stage 2+3
|
Stage 1+2+3
|
|
North
|
1
|
SF9N
|
12
|
650
|
-
|
15528
|
-
|
3024
|
18551
|
-
|
|
SF10N
|
|
3
|
SF11N
|
|
SF12N
|
|
5
|
SF13N
|
9
|
900
|
-
|
12771
|
-
|
3858
|
16629
|
-
|
|
SF14N
|
|
7
|
SF15N
|
|
SF16N
|
|
South
|
2
|
SF9S
|
12
|
650
|
11831
|
-
|
27359
|
1136
|
-
|
28495
|
|
SF10S
|
|
4
|
SF11S1
|
|
SF12S
|
|
6
|
SF13S
|
9
|
900
|
837
|
-
|
13608
|
4882
|
-
|
18490
|
|
SF14S
|
|
8
|
SF15S
|
|
SF16S
|
1 No surface distresses were observed on SF11S
Observations and Preliminary Findings
Instrumentation and Field Testing
- The strain response of EGs installed at the top and bottom of slabs was used to monitor crack initiation, full-depth, and full-length propagation.
- The average PSPA modulus of 12-inch thick slabs was lower than 9-inch thick slabs. This observation confirmed a positive correlation between R values and concrete modulus. Relatively small decreases in the average slab moduli were observed upon trafficking completion, indicating a very slow deterioration rate.
- The HWD test data suggested that the slab structural integrity slowly diminished as the crack propagated longitudinally.
Cracking Strength
- The load-related stress, causing rupture of the PCC slabs, was determined under static loads. The stress level varied between 45% and 75% of the flexural strength of field cured beams. In the previous CC6 strength tests, the estimated rupture stress at the bottom extreme fiber was close to the concrete flexural strength. This discrepancy between CC8 and CC6 tests was most likely due to the presence of non-load-related built-in stresses in the slab. It is speculated that these built-in tensile stresses may be related to the use of a P-306MR, but it will be further assessed when inner lane test data become available.
Moving Load Tests
- Moving loads were applied to the outer lane slabs for full-depth and full-length crack propagation (and crack initiation in the case of not pre-cracked slabs). The effect of slab thickness on Stage 1 of fatigue life (crack initiation) was greater than the effect of concrete strength. Conversely, the effect of concrete strength was more significant than slab thickness during Stages 2 and 3.
- For the slabs on low strength subgrade (CBR 3-4), the cumulative passes/coverages corresponding to the first crack appearance on the south (i.e., comprising crack initiation and full-depth crack propagation) was smaller than the north (i.e., full-depth crack propagation only).
Additional Resources
To be directed to the CC8 Phase 4 Strength & Fatigue Test Database, click here.
To download the CC8 Phase 4 Strength & Fatigue Traffic Test Report — Outer Lanes, click here.
Return to Construction Cycle 8 Overview