CC2 HMA Overlay Post Traffic Testing
HWD: Uniformity of Pavement Structures
Heavy-weight deflectometer (HWD) tests were performed using the FAA’s HWD equipment on a 10-foot (3.05 m) grid to study the uniformity of the pavement structures, see Figure 1. Tests were performed with a 12-inch diameter plate at three different load levels – 12,000, 24,000, and 36,000 lbs (53.4, 106.8, and 160.2 kN). The results showed that the pavement structure within each test item was fairly uniform. For peak center deflection (D0), the coefficient of variation (COV) ranged between 20 to 25 percent. For deflection D7 (at 72-inch (182.9-cm) offset from the center of load plate, and an indicator of subgrade condition), the COVs were around 10 percent. Figure 1 shows that the mean peak center deflections (D0s) for the rubblized test items were larger than the D0 deflections for the unrubblized test items. Also, among the rubblized test items, MRC showed the highest deflections, followed by MRG and then by MRS. This order was counter to expectations because MRC had a crushed aggregate subbase course and would normally be expected to be of higher stiffness than the MRG pavement built directly on the subgrade. Pretraffic measurements of subgrade strength in the test pits showed that water had migrated from the crushed aggregate subbase into the subgrade of MRC and softened the top three or so inches of the subgrade. The surface of the subgrade in the MRC test pits had a strength of approximately 4 CBR whereas the strength one foot (30 cm) below the surface was approximately 8 CBR. The surface of the subgrade in the MRG and MRS test pits was in the range 7 to 8 CBR, as constructed. The order of failure, discussed below, also followed the order of the HWD deflection magnitudes.
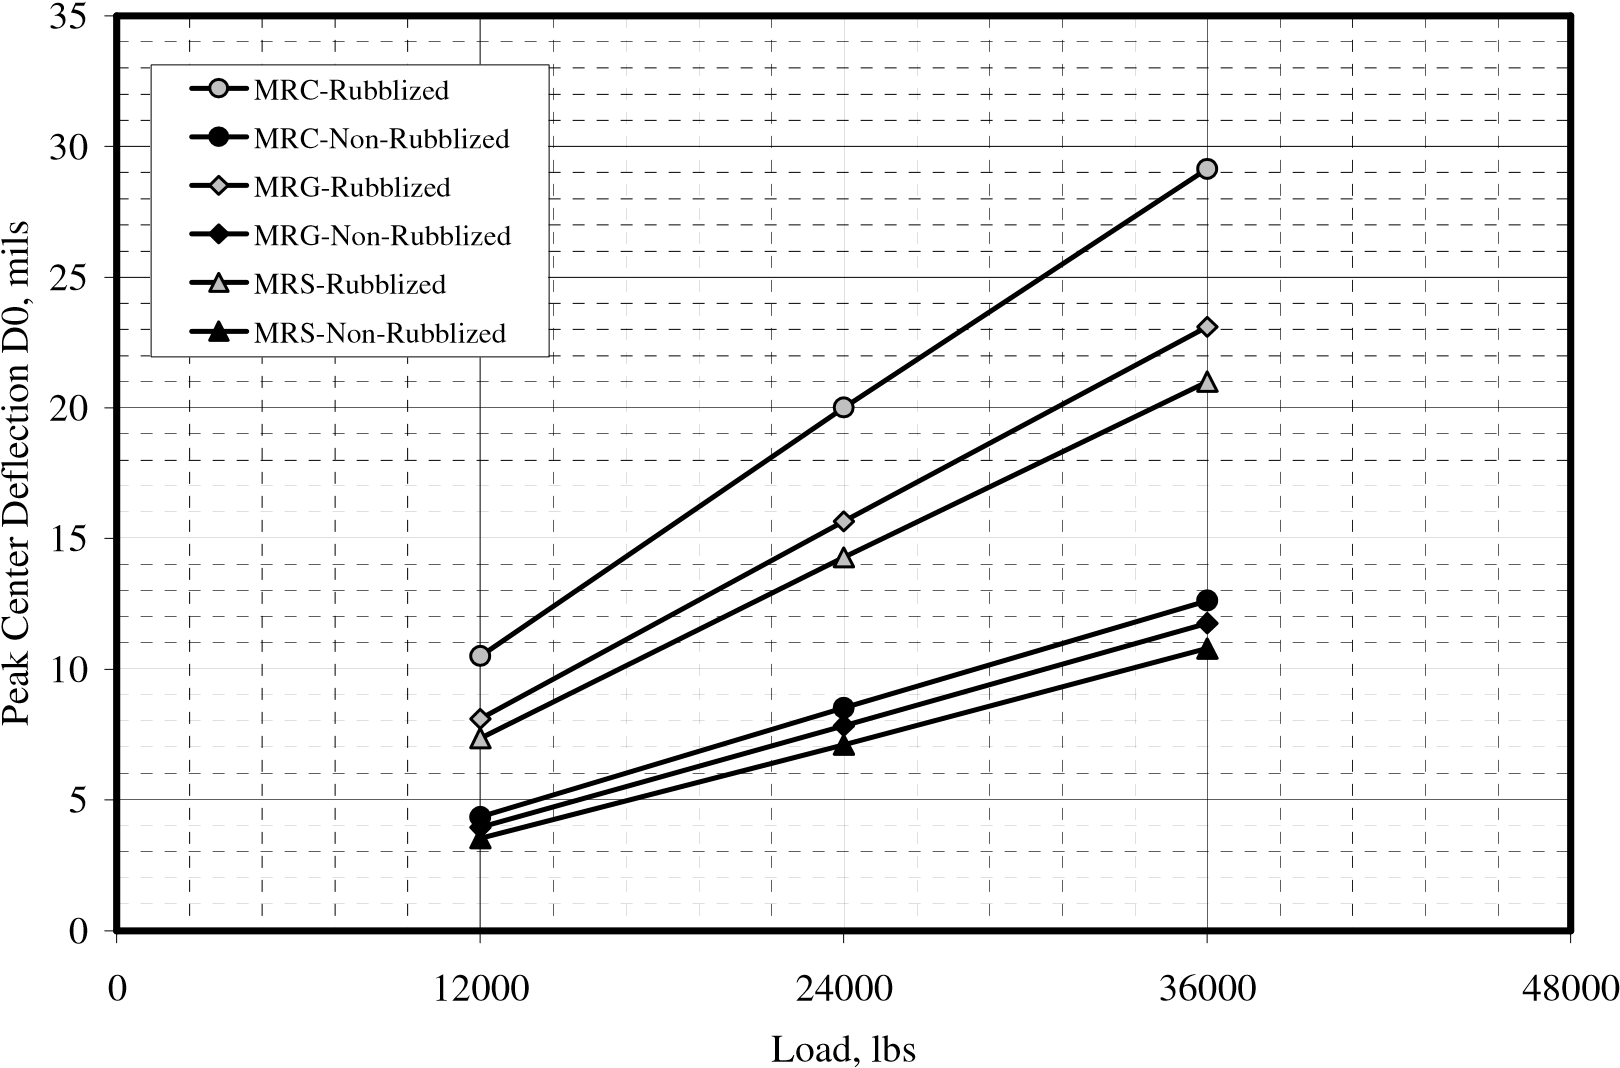
Figure 1. Mean Peak Center Deflections D0 from Uniformity Tests
(1 mil = 25.4 microns)
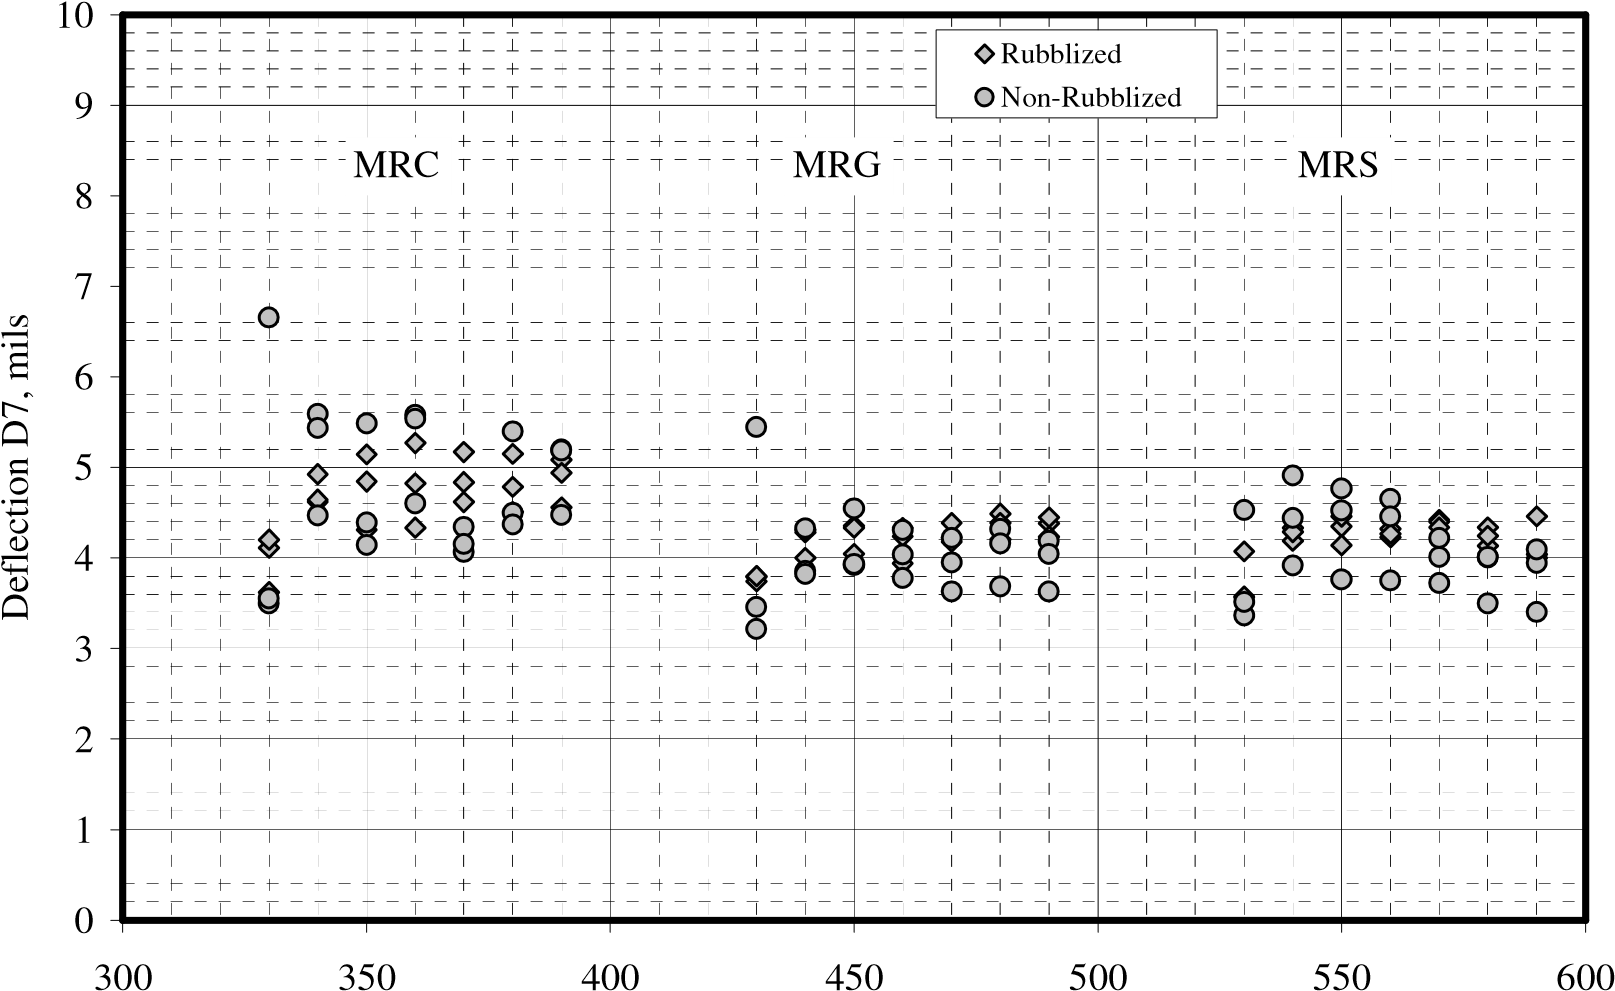
Figure 2 shows deflections D7 (at 72-inch offset from center of plate) that are indicative of subgrade stiffness. Figure 8 is further indication that the subgrade of MRC was of lower stiffness than the subgrade of MRG and MRS.
Station
Figure 2. Deflections D7 from Uniformity Tests (1 mil = 25.4 microns)
Figure 3 shows the AREA for rubblized and non-rubblized test items. AREA is the area of deflection basin normalized with D0 and is a deflection basin shape factor (Hoffman, 1981). The magnitude of the AREA term is a fairly good indicator of layer behavior (bound or unbound). Higher AREA values indicate bound material and lower AREA values indicate unbound material.
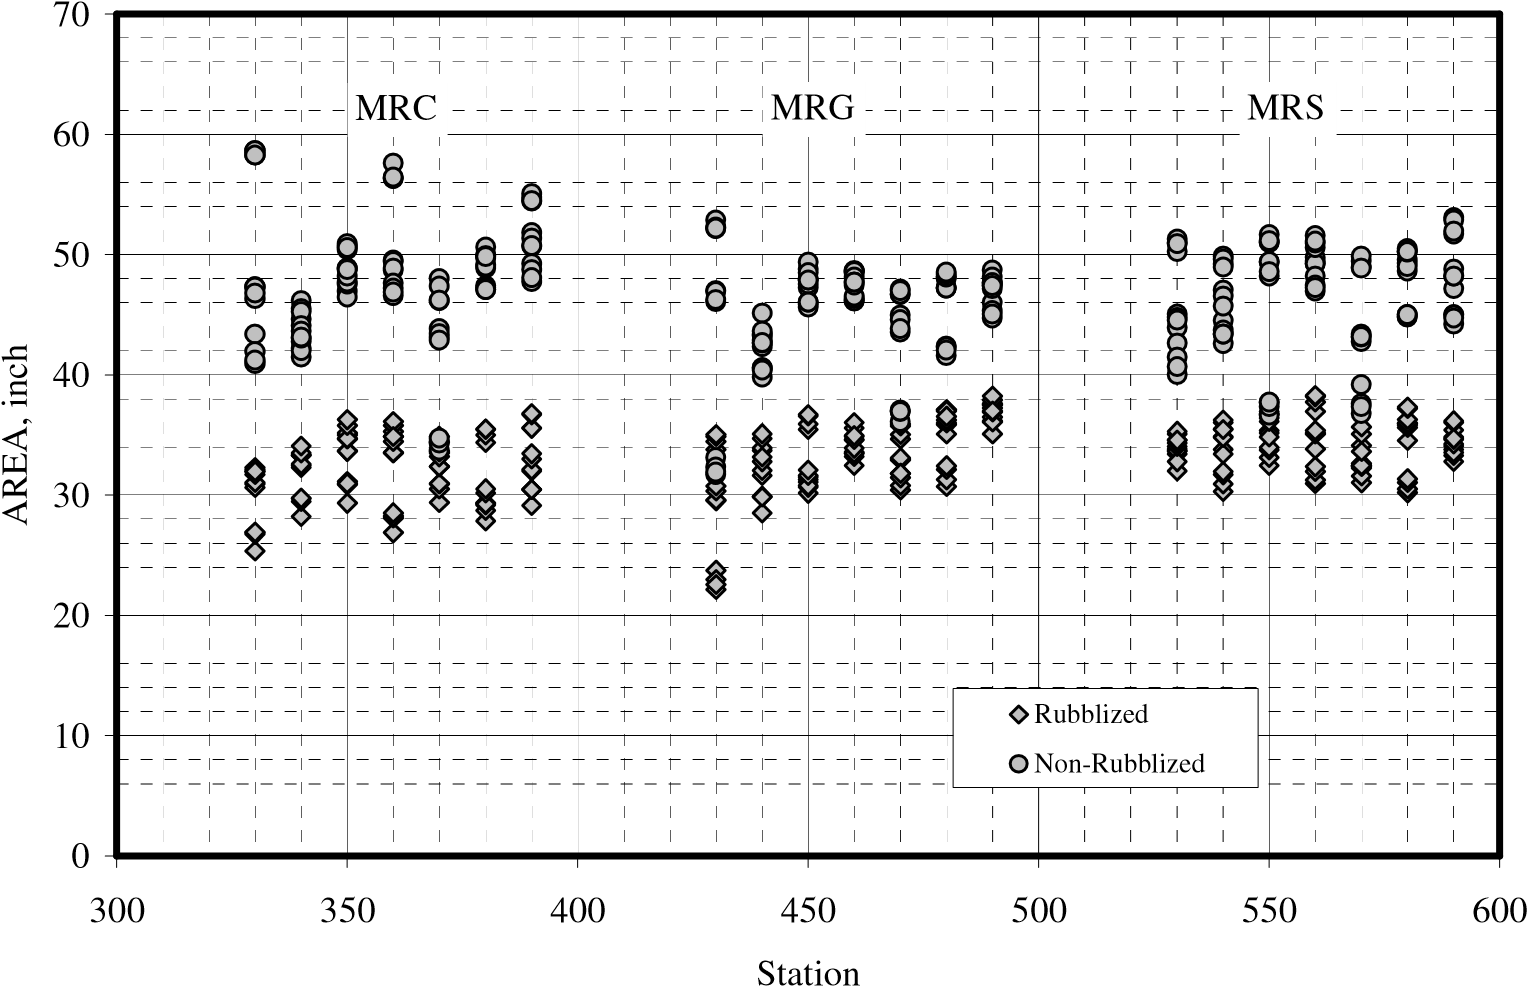
Figure 3. AREA from Uniformity Tests (1 inch = 2.54 cm)
The rubblized test items show lower AREA values (mean AREA = 33.2 inches, (84.3 cm)) compared to non-rubblized test items (mean AREA = 46.6 inches (118.4 cm)).
Backcalculation of Rubblized Concrete modulus
Heavy-weight deflectometer (HWD) tests were routinely performed using FAA’s KUAB HWD equipment at three different load levels – 12,000, 24,000, and 36,000 lbs. A Portable Seismic Properties Analyzer (PSPA) was used in conjunction with the HWD to estimate the asphalt concrete modulus. Pretraffic HWD tests were performed on a 10-foot grid to study the uniformity of the pavement structures. During the traffic tests, HWD tests were performed at 15feet (inside trafficked area) and 5-feet (outside trafficked area) offsets north of centerline. Moduli for the rubblized concrete layer were backcalculated using FAA’s BAKFAA software. The CBR test results from posttraffic testing (trenches) on subgrade (Table 1) were used as the input properties for subgrade layers in the backcalculation procedure. The elastic modulus was backcalculated only for the rubblized concrete layer.
Table 1. Test Results from Posttraffic Trenching Study.
|
Item
|
Trench ID
|
Layer Type
|
Test Type
|
Test Results
|
|
Inside Traffic Path
|
Outside Traffic Path
|
|
MRC
|
MRC-W
|
Rubblized Concrete
|
Plate Load Test
|
-
|
-
|
|
P-154 Subbase
|
Plate Load Test
|
144 pci
|
92 pci
|
|
CBR
|
35.9
|
33.7
|
|
In-Situ Dry Density
|
122.4 pcf
|
122.1 pcf
|
|
Subgrade Surface
|
Plate Load Test
|
-
|
70 pci
|
|
CBR
|
4.8
|
4.4
|
|
In-Situ Dry Density
|
89.4 pcf
|
88.2 pcf
|
|
1-foot Below Subgrade Surface
|
CBR
|
6.8
|
6.4
|
|
In-Situ Dry Density
|
93.1 pcf
|
93.2 pcf
|
|
MRC-E
|
Rubblized Concrete
|
Plate Load Test
|
-
|
270 pci
|
|
P-154 Subbase
|
Plate Load Test
|
-
|
87 pci
|
|
CBR
|
-
|
-
|
|
In-Situ Dry Density
|
-
|
-
|
|
Subgrade Surface
|
Plate Load Test
|
-
|
60 pci
|
|
CBR
|
4.2
|
3.4
|
|
In-Situ Dry Density
|
89.4 pcf
|
86.8 pcf
|
|
1-foot Below Subgrade Surface
|
CBR
|
9.4
|
8.2
|
|
In-Situ Dry Density
|
91.8 pcf
|
93.5 pcf
|
|
MRG
|
MRG
|
Rubblized Concrete
|
Plate Load Test
|
322 pci
|
457 pci
|
|
Subgrade Surface
|
Plate Load Test
|
106 pci
|
149 pci
|
|
CBR
|
11
|
11.2
|
|
In-Situ Dry Density
|
91.7 pcf
|
92.9 pcf
|
|
1-foot Below Subgrade Surface
|
CBR
|
8.8
|
8.2
|
|
In-Situ Dry Density
|
92.0 pcf
|
91.5 pcf
|
|
MRS
|
MRS
|
Rubblized Concrete
|
Plate Load Test
|
780 pci
|
579 pci
|
|
P-306 Econocrete Subbase
|
Plate Load Test
|
409 pci
|
504 pci
|
|
P-154 Subbase
|
Plate Load Test
|
270 pci
|
202 pci
|
|
CBR
|
-
|
-
|
|
In-Situ Dry Density
|
-
|
-
|
|
Subgrade Surface
|
Plate Load Test
|
171 pci
|
101 pci
|
|
CBR
|
6.9
|
6
|
|
In-Situ Dry Density
|
91.3 pcf
|
90.7 pcf
|
|
1-foot Below Subgrade Surface
|
CBR
|
10.4
|
9.3
|
|
In-Situ Dry Density
|
90.0 pcf
|
89.7
|
In the backcalculations, a stiff layer (hard bottom) was placed at 10-feet depth below the pavement surface (this is the depth for which the native subgrade had been replaced with the medium strength subgrade over which the test items were constructed). The native soil was stiff sandy soil. In addition to the backcalculation of rubblized concrete modulus, the deflection data were used to compute the impulse stiffness modulus (ISM) defined as the force amplitude divided by peak center deflection D0. The deflection basin shape parameter AREA was also computed. More details about backcalculation, ISM, and AREA can be found in the Advisory Circular 150/5370-11A.
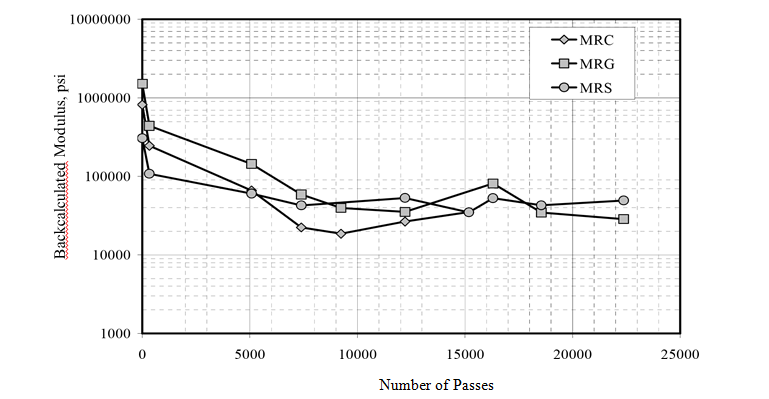
Figure 4. Changes in the Modulus of Rubblized Concrete During the Traffic Tests.
Figures 4, 5, and 6 show the variation in the backcalculated modulus of the rubblized concrete layer, ISM, and the deflection basin shape factor AREA inside the trafficked area as the traffic testing progressed.
Figure 4 shows that the rubblized concrete modulus reduces to approximately 30 percent of the initial modulus value after 330 passes for all of the three test items. The pavement performance as indicated by rut depth does not show a decline of this magnitude. In fact, for the first 5000 passes, the maximum rut depth in all of the three test items is about 0.25-inches. After 5000 passes, the modulus drops down to approximately 20,000-psi for MRC, 40,000-psi for MRG, and 50,000-psi for MRS. These results indicate that backcalculated modulus may not be a good predictor of pavement performance when applied to a flexible pavement design procedure (see further discussion below).
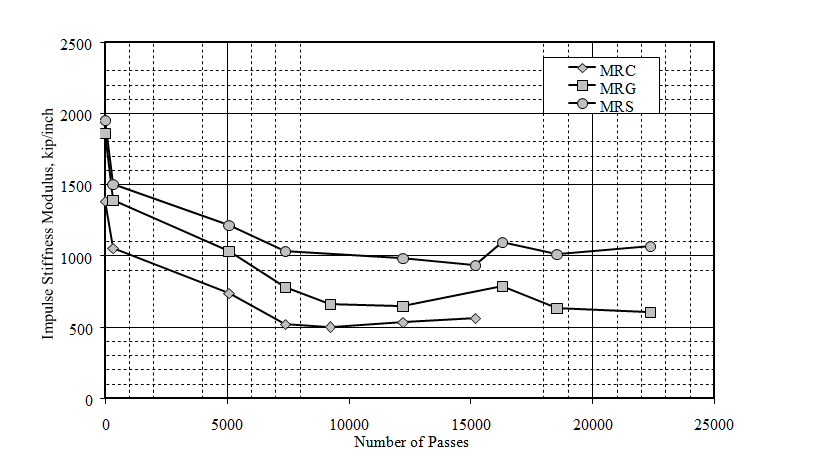
Figure 5. Changes in the Impulse Stiffness Modulus (ISM) During the Traffic Tests.
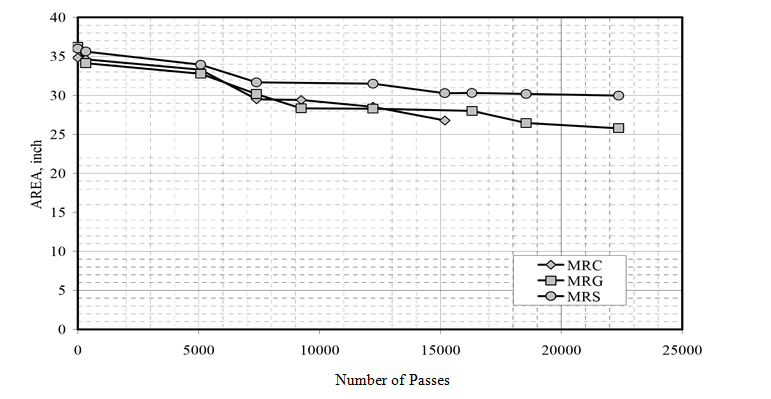
Figure 6. Changes in the Deflection Basin Shape Factor AREA During the Traffic Tests.
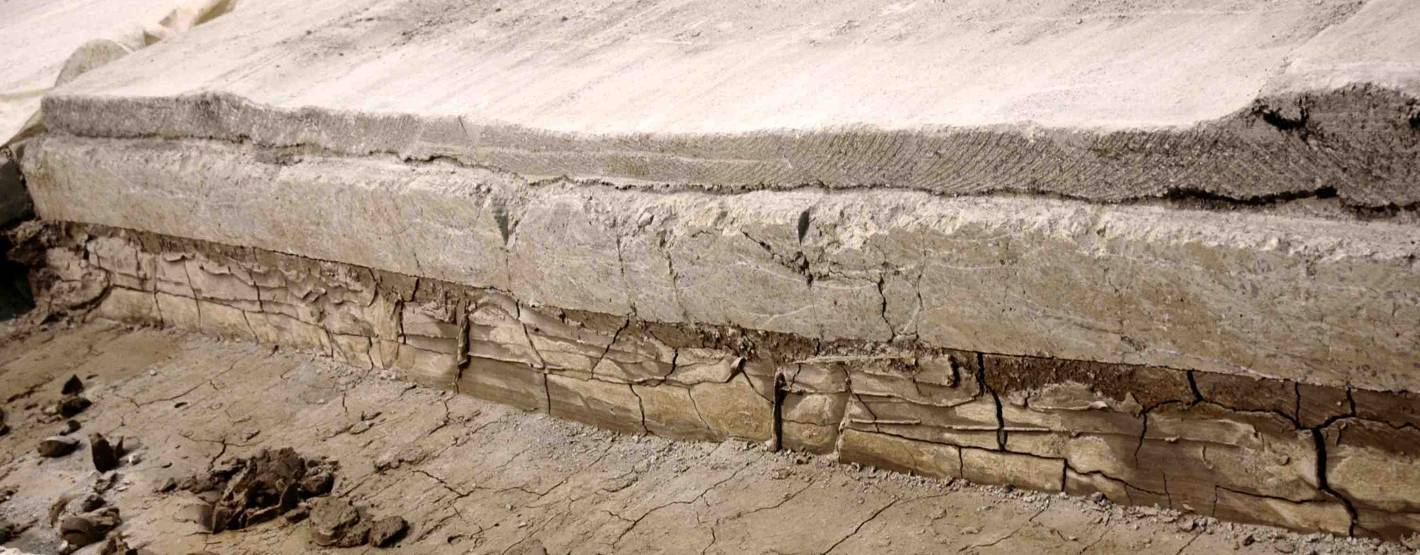
Figure 7. Photograph of MRG Trench.
The results from posttraffic testing in the trenches show that, in test item MRC, the failure in the subgrade resulted in failure of the pavement structure, including the full depth of the rubblized layer. In test item MRC, the top 3 to 4 inches of the subgrade had reduced strength (CBR 3 to 4) because of moisture migration from the P-154 subbase into the subgrade. This weak layer of subgrade allowed for higher vertical deflection in the pavement structure which resulted in a faster rate of deterioration of interlock between the rubblized concrete pieces and ultimate failure of the pavement structure. Profile measurements showed that the top of the rubblized layer (3 inches of finely rubblized material) contributed to the rutting. Excluding the top 3 inches of finely rubblized material, the rubblized concrete layer behaved as a tightly interlocked high density unbound base. The strength of the rubblized concrete layer was derived from the tight interlock between the rubblized concrete pieces and the confinement provided by the HMA overlay and the support system underneath (subbase and subgrade etc.). As can be observed from Figure 7 (for MRG) and Figure 8 (for MRS), the rubblized layer did not experience severe deterioration since the support system and the HMA overlay provided sufficient confinement and allowed for limited vertical movement. This resulted in longer pavement structural life.
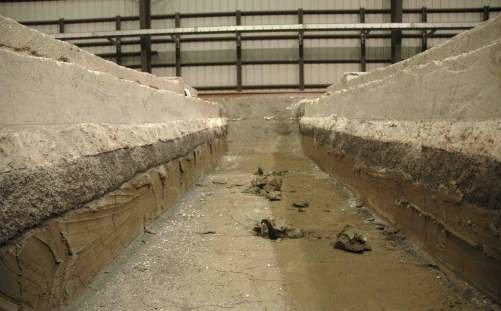
Figure 8. Photograph of MRS Trench.
The test pits opened in the rubblized concrete layers prior to the placement of the HMA overlay showed that, in general, the top 2 to 3 inches in all of the test items was reduced to dust and stones with a top particle size of 1 inch. The particle size in the bottom 9 inches ranged from 4 inches to 15 inches with larger particle sizes in MRS. The test pits showed that the rubblization process induced angled cracks, or, more accurately at this stage, fractures, through the entire depth of the slabs and that the cracks were tightly held. This interlock deteriorated under repeated wheel loads, as shown in the posttraffic trenches. The rate of deterioration is controlled by various factors. Some of the important ones are the magnitude and wander of wheel loads, loss of confinement due to fatigue cracks in the HMA overlay layer, and loss of confinement due to weak support system (underneath the rubblized concrete layer) allowing high vertical deflections in the pavement structure. The increased crack-width between the rubblized concrete pieces would also contribute to the increased peak surface deflections. Another factor contributing to the vertical deformation is the top 2 to 3 inches of fine material under the HWD load, where increased peak center deflections could result backcalculated modulus values lower than expected. The HWD tests inside the traffic path were centered over an underlying dowelled longitudinal joint. During the posttraffic trenching study, it was observed that the rubblization process did not debond the dowels from the two adjacent slabs and the size of concrete pieces ranged from 3-feet to 4-feet in length and width. It is quite possible that this may have contributed to the higher peak center deflections rather than the deterioration of the rubblized concrete layer. However, all these factors did not significantly affect the performance of the rubblized layer as was observed from the rut depth measurements.
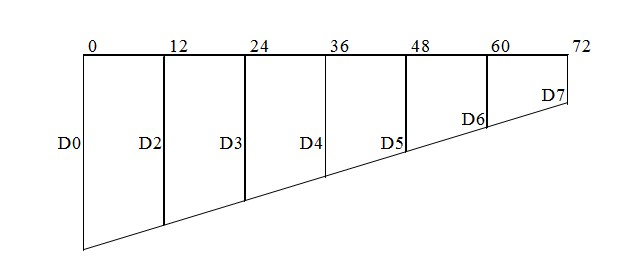
Figure 9. Typical Deflection Basin Under HWD Load.
Figure 9 shows the changes in deflection basin shape factor AREA during the traffic tests. In order to illustrate the procedure used to calculate the AREA shape factor, figure 12 shows a hypothetical deflection basin measured during an HWD test. D0, D2, D3, D4, D5, D6, and D7 are deflections measured at 0-, 12-, 24-, 36-, 48-, 60-, and 72-inch offsets from the center of the load plate.
AREA is the area of the deflection basin after all of the deflections have been normalized using peak center deflection, D0, and is computed as follows:
6*[2*(D2+D3+D4+D5+D6) + (D0+D7)] / D0
For the first 5068 passes (at 55,000 lbs wheel load), all of the three test items showed similar rut depths. The AREA values (Figure 7) also suggest similar behavior. The AREA values for test item MRC are somewhat overstated after about 7000 passes because the HWD tests could not be performed in the north east area of the test item due to large rut depths as that part of the test item deteriorated towards failure.
At the end of trafficking, the AREA values were reduced by approximately 29-percent of the initial value for MRG, and reduced by 17-percent for MRS. The rubblized concrete in the MRG and MRS trenches (Figures 8 and 9) showed no significant signs of deterioration at the end of trafficking.
Pavement Life Computations
According to EB-66, “Rubblized pavements modulus have been found to vary from a low of 30 ksi to over 300 ksi depending on the original pavement thickness, base type and condition of base layers. When strength parameters are unknown, it is a fair assumption that most rubblized material will perform equal to or better than FAA standard Item P-209. Unless additional project specific information is available, a one-to-one substitution should be used in the design procedures provided that sufficient subgrade conditions exist to allow proper rubblization.” Approximately the same range of backcalculated modulus values were measured during trafficking of the three test items, although significantly higher values were measured in MRC and MRG before trafficking. The value of approximately 300,000 psi measured in MRS before trafficking was at the top end of the EB-66 range.
Using the EB-66 assumption stated above (of treating the rubblized concrete layer as a P-209 crushed stone base), pavement life was computed using LEDFAA-1.3. The subgrade CBR is the average of CBR values (Table 1) at the top of the subgrade and a depth 1-foot below the subgrade surface. The design CBR values were computed in similar way as in the new alpha factor report. The results are summarized in Table 2.
Table 2. Predicted Life Computations Using LEDFAA-1.3.
|
Test Item
|
Pavement Life, passes
|
|
Wheel Load passes
|
Observed Pavement Life, passes
|
|
4-Wheel 55,000 lb.
|
6-Wheel 65,000 lb.
|
|
MRC
|
236
|
29
|
14652
|
|
MRG
|
42
|
10
|
25608*
|
|
MRS
|
385418
|
6343
|
25608**
|
*Appeared to be suffering from structural upheaval; trafficking terminated.
**No signs of failure; trafficking terminated.
The traffic tests for the first 5068 passes were performed at 55,000 lbs. wheel load and 4- wheel gear. After that, the traffic tests were performed at 65,000 lbs. and 6-wheel gear. Comparing the observed pavement life (Figure 6) and predicted pavement life (Table 2), the results show that using EB-66 assumptions are very conservative and LEDFAA-1.3 grossly underpredicts pavement life as measured in the full-scale tests reported here.