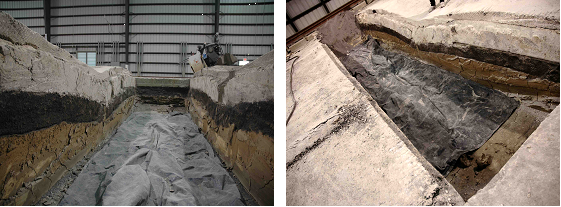
The purpose of the trenches was to conduct post-traffic investigation into the failure mechanism of the pavement structure.
The trenching involved removal of the P-401 HMA layer, the rubblized
concrete layer, the P-209 crushed stone base and P-306 econocrete layer (in MRS), and the P-154 subbase layer (in MRC) to reveal the subgrade interface and subsequent subgrade layers below.
After removing the P-401 HMA surface, the rubblized concrete layer was exposed in all four trenches. Plate load tests (AASHTO Designation: T 222-81, 2000) were performed inside and outside the traffic path on the surface of the rubblized concrete layer, and visual observations were made. Removal of the rubblized concrete layer exposed the P-154 surface in the MRC trenches, the subgrade surface in the MRG trench, and the P-306 econocrete subbase surface in the MRS trench. In the MRC trenches, plate load tests, CBR, and sand cone density measurements were taken on the surface of the P-154 layer. In the MRG trench (on the subgrade surface) the tests included CBRs, insitu density measurements (drive cylinder), and plate load. Only the plate load tests were performed on top of the P-306 econocrete layer in the MRS trench. After removing MRC P-154 subbase, CBRs and plate load tests were performed, and density measurements were taken on the subgrade surface. In MRS, P-306 was removed to expose the P-154 subbase surface on which plate load, sand cone, and CBR tests were performed. CBR and plate load tests were performed, and density measurements were taken on the subgrade surface after removal of the P-154 subbase. In all the trenches, CBRs and density measurements were also taken at a depth of 1-foot (305 mm) below the subgrade surface. After completing the test, the trench walls were cleaned to clearly expose the layer interfaces.
Measurements of the pavement layer interface profiles were taken relative to a horizontal string line to quantify the contribution of each component layer to the total pavement rutting and upheaval.
After the three test items were rubblized, a 4-foot (1.22 m) long by 4-foot (1.22 m) wide test pit was saw cut in each test item for visual examination of the rubblized concrete (extent of fractures from rubblization process, particle sizes, etc.). Figure 6 shows fracture patterns and particle sizes in test items MRC, MRG, and MRS respectively. In general, the top 2 to 3 inches (5 to 7.6 cm) in all the test items was rubblized into dust and stones with a top particle size of 1 inch (2.54 cm) (Figure 1). The particle size in the bottom 9 inches (22.9 cm) ranged from 4 inches (10.16 cm) to 15 inches (38.1 cm) with larger particle sizes in MRS. The test pits showed that the rubblization process induced cracks/fractures for the entire depth of the slabs and that the cracks were tightly held.
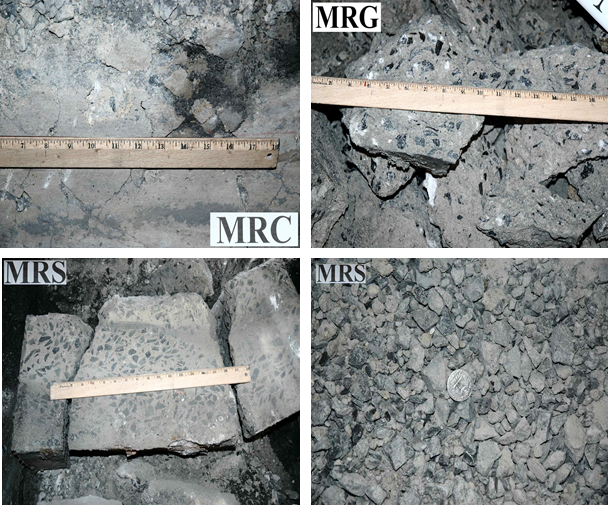
Figure 1. Visual Observations from the Test Pits in Rubblized Test Items
The NE end of MRC was the first area of the rubblized pavements to show signs of failure (Figure 3, 4). This failure was not representative of the structural performance of the test item as a whole because one of the pre-overlay test pits (for subgrade evaluation) was located where the pavement failed. A weakened support system resulted because the replaced subbase aggregate material could not be compacted to the same density as in the original construction. A depression in the pavement surface was observed at this location after about 400 load repetitions. The depression migrated longitudinally towards the east until it was about 15 feet (4.6 m) long, but the structure continued to support the full traffic load until it appeared to be in danger of suffering complete structural collapse at 11,814 passes. The weakened area did not migrate back into the west half of the test item and the declared structural life of MRC-NW of 14,256 passes is believed to be a true representation of the structural performance of the test item. Also, MRC-NW did not appear to be in danger of complete structural collapse as had MRC-NE. Trafficking in MRG and MRS was terminated after 25,608 passes. From visual inspection at the end of trafficking, MRG-N appeared to be suffering from structural upheaval outside the wheel track but MRS-N did not. Figure 8 shows the photographs of trench faces in test item MRC and close-ups of the failure zones. Figures 9 and 10 show photographs of the MRG and MRS trenches respectively.
MRC-W Trench
MRC-E Trench
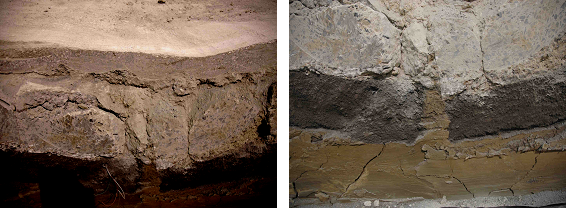
Close-up of Failure Zone (MRC-W) Subgrade Intrusion Into Subbase (MRC-E)
Figure 8. Photographs from MRC Trenches.
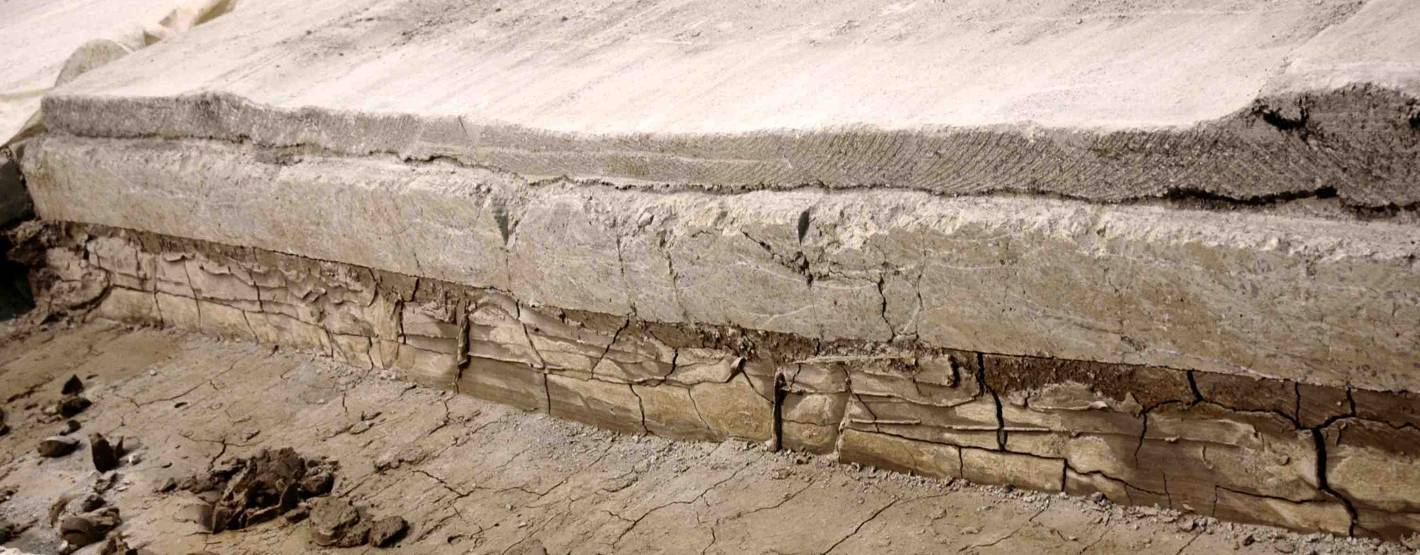
Figure 9. Photographs from MRG Trench.
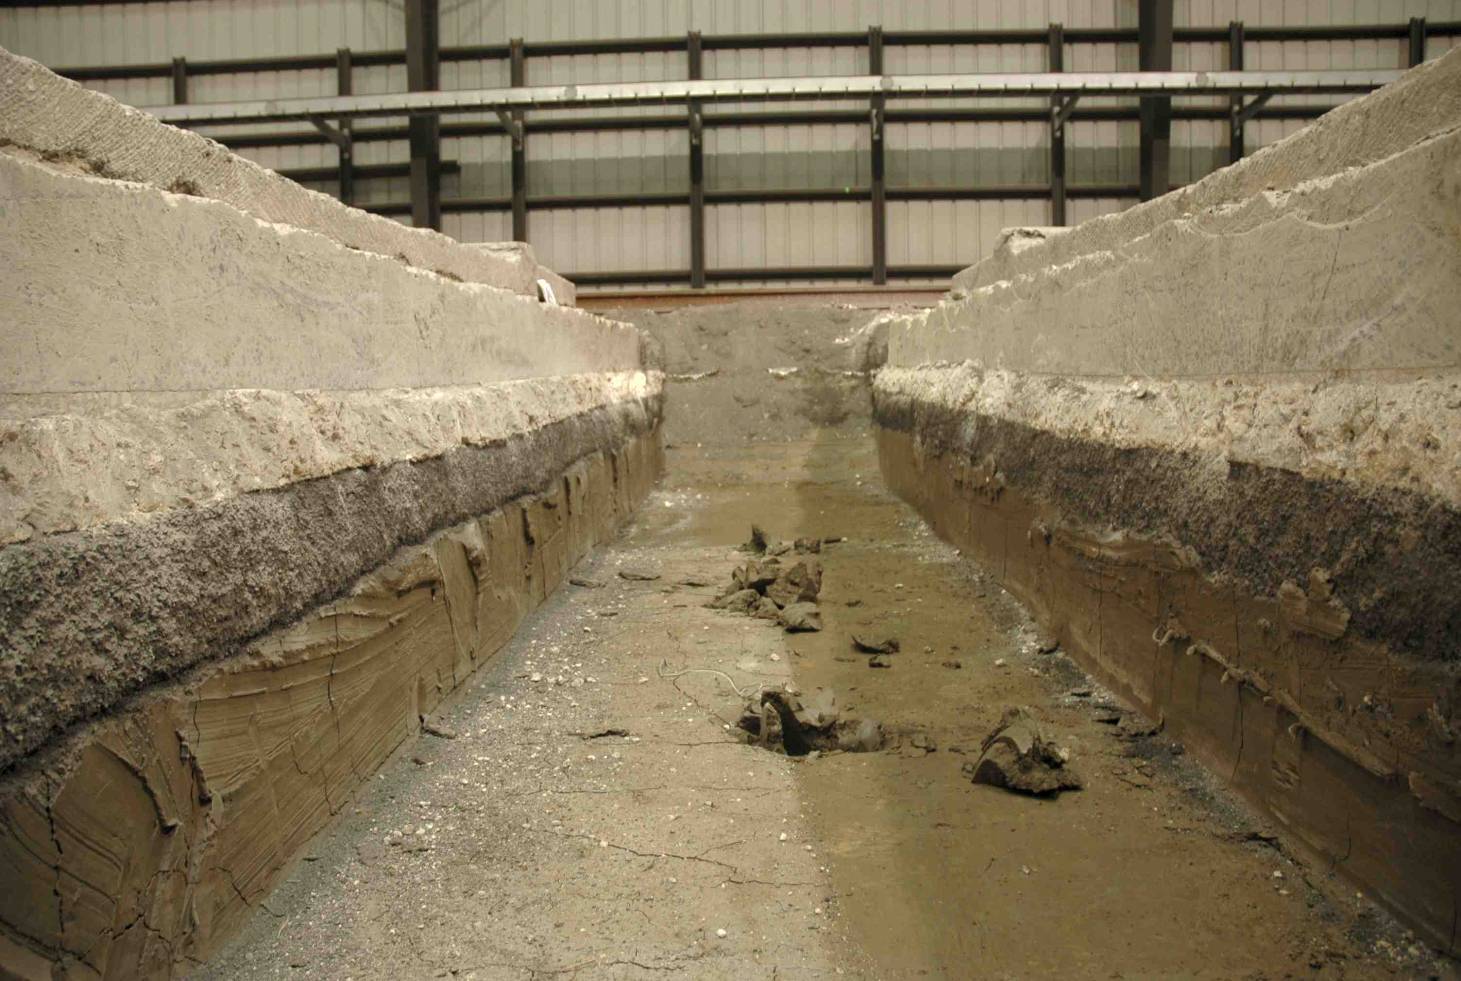
Figure 10. Photograph from MRS Trench.
Excluding the top 3 inches (76 mm) of finely rubblized material, the rubblized concrete layer behaved as a tightly interlocked, high-density unbound base. The strength of the rubblized concrete layer is derived from the tight interlock between the rubblized concrete pieces and the confinement provided by the HMA overlay and the support system underneath (subbase and subgrade). This interlock will deteriorate under repeated wheel loads. The rate of deterioration is controlled by various factors. Some of the important ones are as follows: