Heavy Weight Deflectometer (HWD) Round-Up
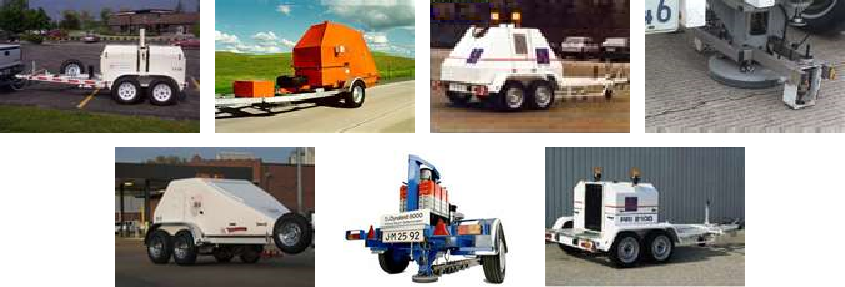
HWD Line-Up (Click to Zoom)
The Heavy Weight Deflectometer (HWD) Round-Up was a nondestructive experiment done to evaluate different HWD models and conduct comparisons between them. It was performed at the National Airport Pavement Test Facility (NAPTF), the FAA’s large-scale fully controlled pavement test area. Its ability to minimize variables is critical for experiments such as this. A HWD determines pavement properties by dropping a weight onto the pavement, then measuring the surface deflection at multiple distances from the center of the load using a sensor array. Through a process known as backcalculation, the modulus (stiffness) of each pavement layer can be estimated without damaging the structure. HWD testing enables improvement in the areas of pavement design, evaluation, construction, and management.
The objectives of the HWD Round-Up were as follows:
- to show the value and proficiency of HWD equipment
- to compare HWD under impulse loading to National Airport Pavement Test Vehicle (NAPTV) under moving gear
- to compare different HWDs in raw deflection data and backcalculated modulus values
- to evaluate HWD specifications and methodologies for use in pavement design and construction
The timeline of the HWD Round-Up was as follows:
- Test Area Construction: December 2009 to May 2010
- NAPTV Load Testing: October 2010 (before all HWD testing)
- Initial HWD Testing: October to November 2010, April 2011
- Additional HWD Testing: January 2017, April 2018, and August 2018
- Pavement Coring: January 2017
- Asphalt Pavement Failure: August 2018
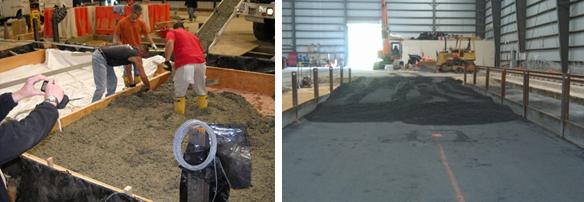
Test Bed Under Construction, Left: Concrete Section, Right: Asphalt Section (Click to Zoom)
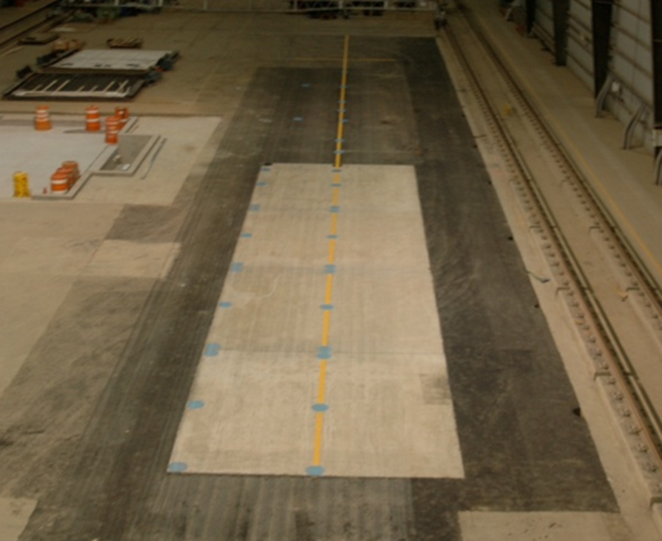
Completed Test Bed (Click to Zoom)
The HWD Round-Up test bed consisted of two 15 foot by 60 foot sections, where one section had an asphalt (flexible) pavement surface and the other a concrete (rigid) pavement surface. During construction, sensors were installed at various locations and depths throughout the test bed to record internal temperature, strain, deflection, and pressure data. The soil subgrade is identical for both sections, but the subbase and base layers differ. The concrete surface is made up of four 15 foot by 15 foot slabs, which allows for testing along slab joints.
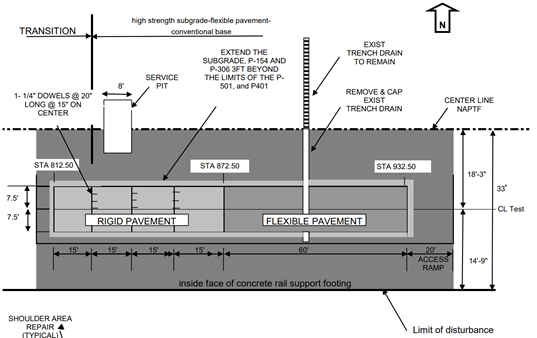
HWD Round-Up Pavement Surface Plan (Click to Zoom)
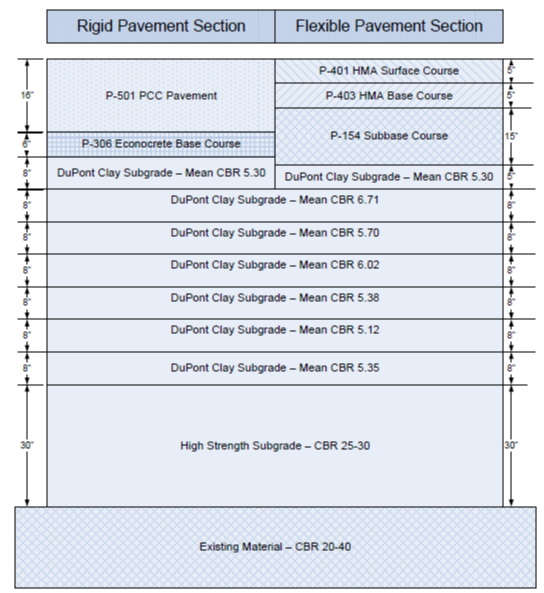
HWD Round-Up Pavement Depth Plan (Click to Zoom)
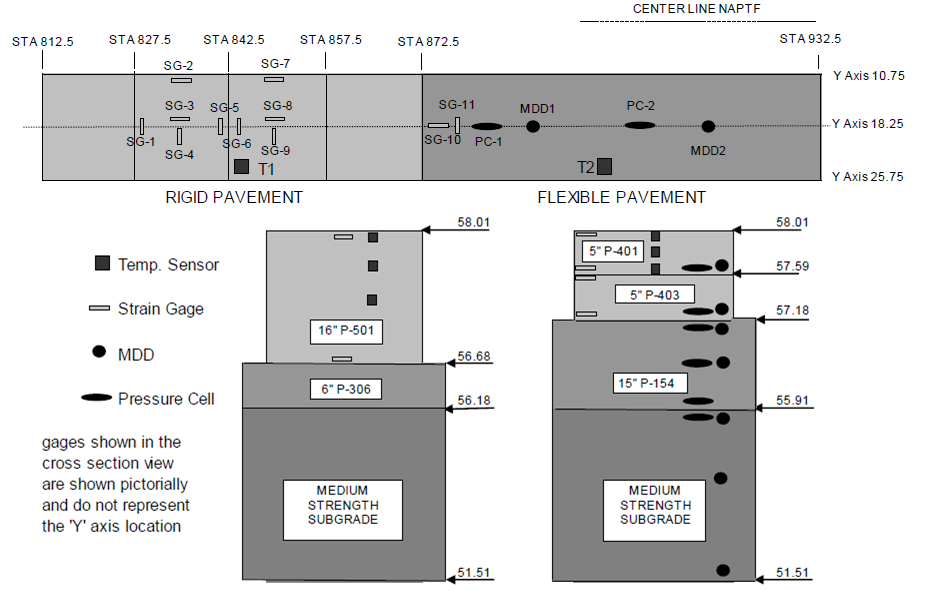
HWD Round-Up Embedded Sensor Plan (Click to Zoom)
Before HWD testing, loading was done with the National Airport Pavement Test Vehicle (NAPTV), a rail-based vehicle spanning the NAPTF that simulates aircraft loading with adjustable gear configuration and loading weight. NAPTV loading consisted of static tests with a varying load (similar to an HWD), and dynamic rolling tests with a constant load (traditional aircraft loading). Data was recorded using the embedded sensors.
Afterwards, the following eight HWDs performed testing for the round-up: FAA KUAB, ARA Dynatest, McQueen JILS, ERI KUAB, PaveTesting, Carl Bro, Carl Bro Super Heavy, and ERDC Dynatest. These HWDs have different manufacturers and owners, and each have subtle differences. HWD loading was done in a standard method at each drop location, consisting of a seating drop follow by three drops with increasing weight. Thirty-three drop locations were chosen based on embedded sensor positions as well as important slab areas, like corners and edges. The drop locations were the same for all HWDs, and were shared with the NAPTV static tests. Select locations were tested twice to examine repeatability. Each HWD was tested one at a time, most on individual days.
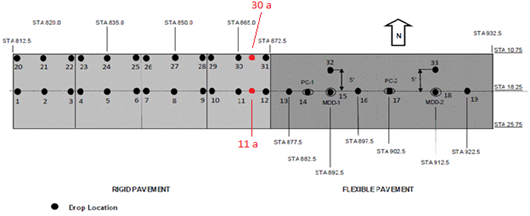
HWD and NAPTV (Static) Test Locations (Click to Zoom)
BAKFAA was used in the round-up to analyze the HWD data. This software performs backcalculation, a process where mathematical iteration is employed to best determine the modulus of the pavement layers while minimizing error. Additionally, the FAA program TenView was used to view data streams for the embedded sensors, so named because ten data plots can be viewed at once. This allows a comparison to be made between the HWDs and the NAPTV.
For more information on the devices/software mentioned on this page, follow the links to the detailed FAA webpages.
NAPTV
HWD
BAKFAA
Return to Showcase Research Projects Overview