Reflective Cracking Phase VII
Phase VII Test Summary
Reflective Cracking Indoor Phase -VII (RCIP-VII) full-scale tests started on February 14, 2023. After 7357 loading cycles, RCIP-VII test concluded on April 20, 2023.
Objective
The primary goal of Phase VII is to collect data for further refinement of reflective cracking analytical models. The data collected during Phase VII will fill gaps in the existing research to support validation of the parameters for the analytical Mode I reflective cracking model. The model will be specific to the P-401 asphalt mixture for FAARFIELD pavement design. Phase VII also has a secondary goal to provide reference data for future phases of this experiment. To support these goals, the specific objectives of RCID Phase VII were to:
- Characterize the strain distribution and estimate the failure strain under simulated thermally induced loading.
- Identify the crack initiation sequence under simulated thermally induced loading.
- Estimate the crack propagation rate (CPR) under simulated thermally induced loading.
- Identify the effect of different overlay thicknesses on CPR.
Overlay Design
Design of RCID Phase VII commenced in October 2021 and was completed in February 2022. The plans called for removal and replacement of AC in the sampling area, test area, and the overrun area (Figure 1). The test area was comprised of two 5-foot wide by 30-foot-long areas, with P-401MR (PG 64-22) asphalt mixes placed directly on top of the PCC surface (Figure 2). The asphalt in the sampling area was placed on top of a PCC surface and was used for acceptance cores and materials characterization samples. The asphalt in the overrun area was placed directly on top of a compacted dense-graded aggregate base course. Cross sections of the test area can be found below in Instrumentation section. Full design specifications and plans can be found in Appendix A "Construction Specifications" of construction report (Ref. [1]) here and Appendix B "Design Drawings" here .
The north and south test areas were designed for 3-inches and 6-inches, respectively. Pavement design software was not used explicitly in determining the thicknesses of the various pavement materials within the individual test areas of RCID Phase VII. The north test area thickness of three inches was selected based on the minimum asphalt overlay thickness on rigid pavement allowed by FAA Advisory Circular 150/5320-6G Airport Pavement Design and Evaluation (Federal Aviation Administration, 2021). The south test area thickness of 6 inches was selected for constructability purposes (place identical 3-inch lifts on top of each other) and allow for comparison to future tests using overlay reinforcement.
Construction
Demolition activities began in December 2022 with milling the existing RCID Phase VI sampling, testing, and overrun areas. Formed paving of both test areas took place in January 2023 with instrumentation of the test areas occurring between December 2022 and February 2023. The north test area was constructed in one lift and the south test area was constructed in two lifts. Acceptance results are provided in the table below.
The construction report (Ref. [1]) can be found here.
An overview of the Reflective Cracking Phase VII can be seen below. For a pdf version of the Reflective Cracking Phase VII As-Built Drawings, click here.
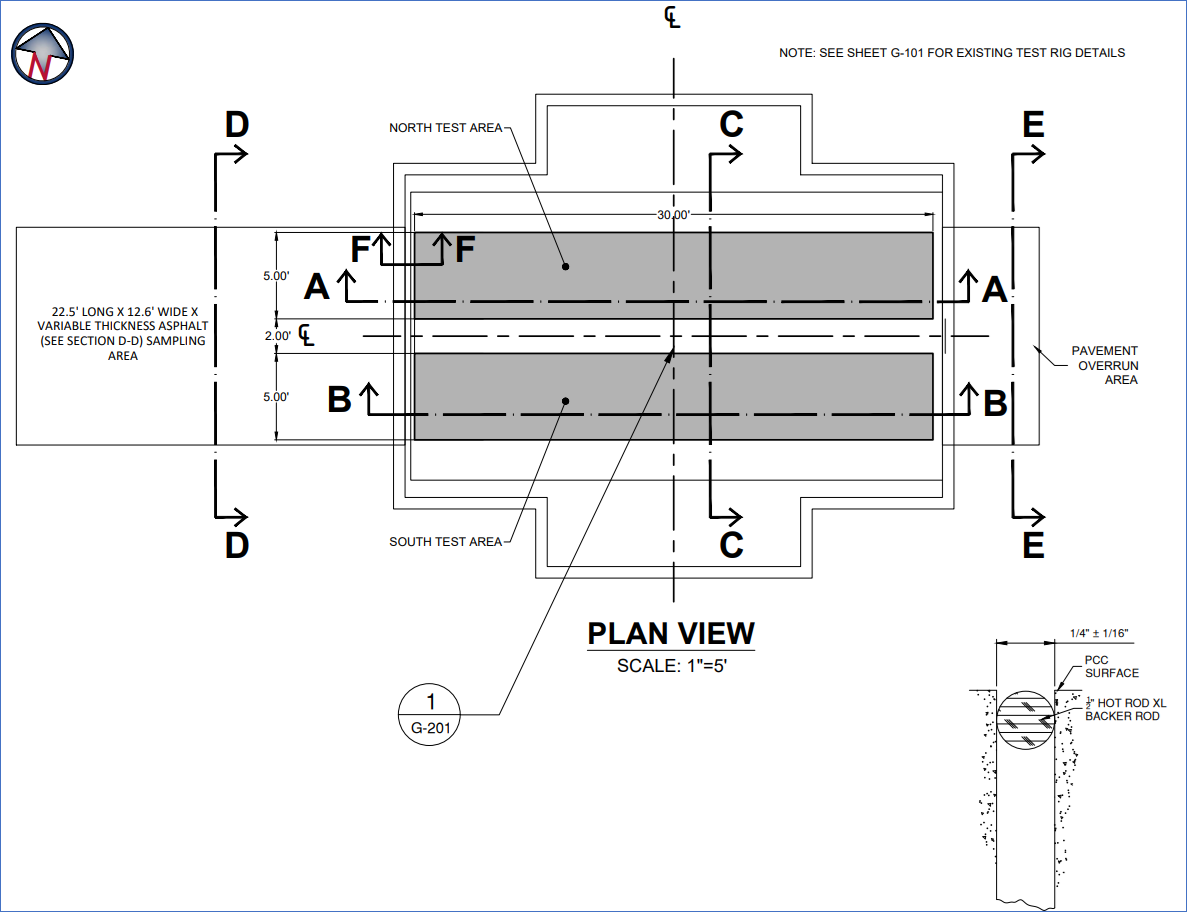
Figure 1. Reflective Cracking Phase VII Plan View (Click to Zoom)
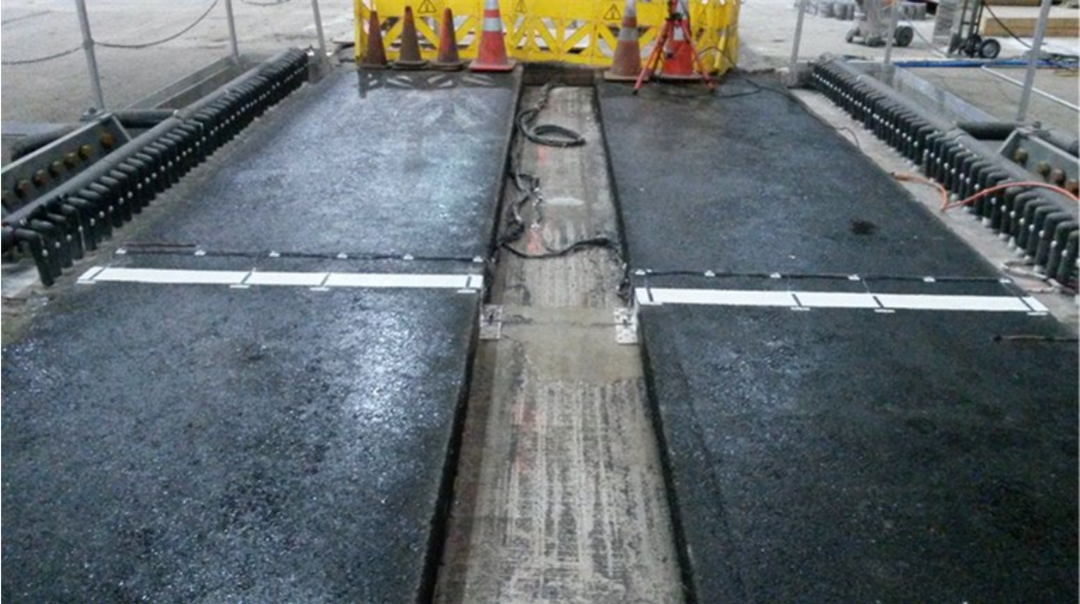
Figure 2. Completed RCID Phase VII Test Strips Prior to Testing (Click to Zoom)
Instrumentation
Seven types of gauges were selected for use in RCID Phase VII to address the objectives: eddy current sensors (ECS), embedded strain gauges (EG), joint displacement gauges (JDG), potentiometers (POT), surface strain gauges (SG), thermocouples (T), and linear variable displacement transducers (LVDT). The JDGs, ECS, POTs, and LVDTs were installed as a means of monitoring the performance of the RCID Rig/TESS (Temperature Effect Simulation System) and will be reused for this experiment. The purpose of each gauge can be found below in Table 1. Figures 3, 4, 5 and 6 show locations of gauges within the test items. Most of the data acquisition (DAQ) hardware used to collect instrumentation data was installed during previous RCID phases and will be reused for this experiment.
Table 1: Purpose of Each Sensor Type
|
Sensor Type
|
Measured Response
|
Purpose
|
Quantity
|
|
Eddy Current Sensor
|
Distance from target, mils
|
Verify the joint opening throughout the testing
|
2
|
|
Embedded Strain Gauge
|
Strain or deformation, µε
|
Capture material strain inside the asphalt layer throughout testing
|
13
|
|
Joint Displacement Gauge
|
Displacement, mils
|
Measuring joint opening
|
4
|
|
Potentiometer
|
Displacement, mils
|
Measure slab movement as part of TESS monitoring
|
6
|
|
Surface Strain Gauge
|
Strain, µε
|
To capture surface strain and detect cracks on asphalt surface
|
10
|
|
Thermocouple
|
Asphalt temperature, oF
|
To capture the environmental changes in the asphalt at varying depths
|
13
|
|
Linear Variable Displacement Transducer
|
Displacement, mils
|
Measure slab movement as part of TESS monitoring
|
4
|
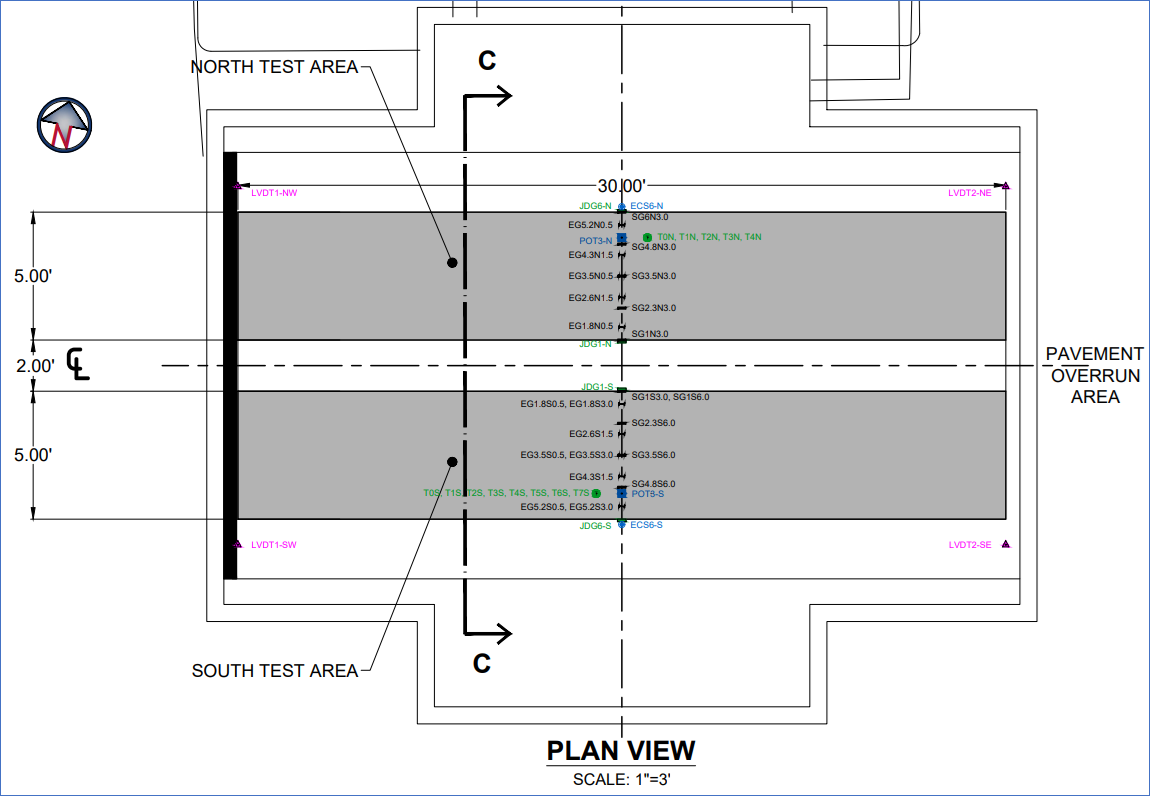
Figure 3. Reflective Cracking Phase VII Instrumentation Plan View (Click to Zoom)
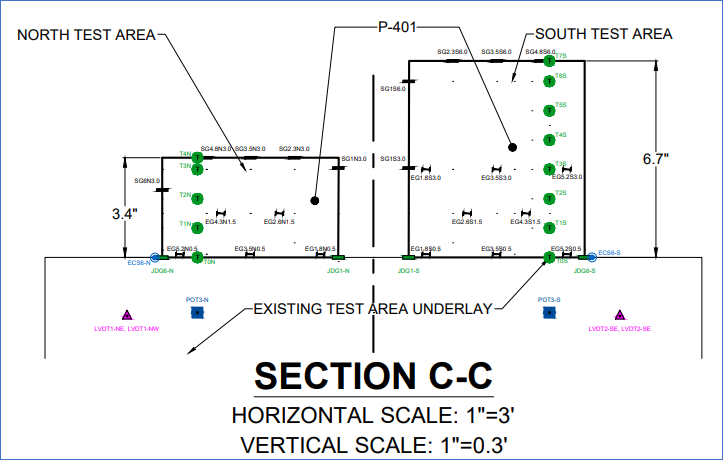
Figure 4. Reflective Cracking Phase VII Instrumentation Profile View (Click to Zoom)
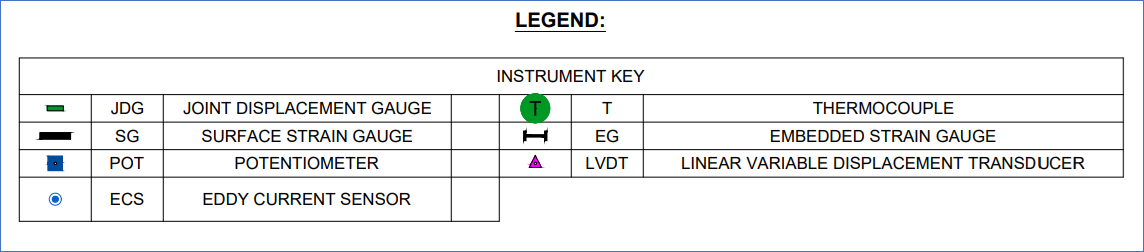
Figure 5. Reflective Cracking Phase VII Instrumentation Legend (Click to Zoom)
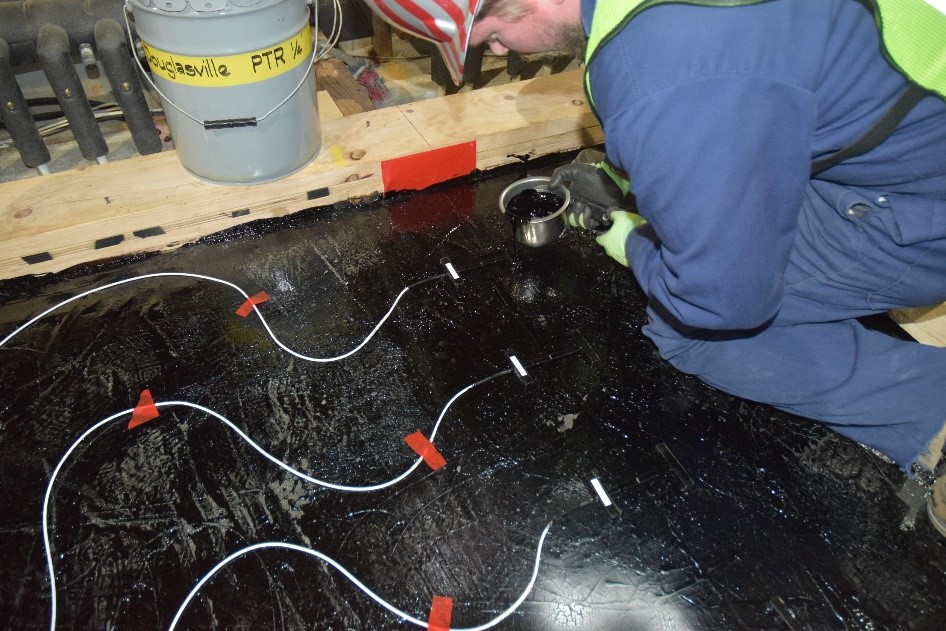
Figure 6. Tacking Embedded Strain Gauges to PCC Surface (Click to Zoom)
Testing Protocol
The TESS precisely controls the width of the joint opening between the two slabs. Table 2 shows the loading parameters. Temperature variations were simulated by cyclically increasing and decreasing the initial 250-mil joint width by 12 mils according a haversine waveform. The DAQ recorded sensor response at 1Hz, placing data from each cycle in a separate file.
Table 2: RCID Phase VII Test Parameters
|
Parameter
|
Value
|
|
Loading type
|
Cyclical, displacement controlled
|
|
Displacement rate
|
0.16 mil/s
|
|
Loading time
|
75s
|
|
Minimum (resting) joint opening
|
250mil
|
|
Change in joint opening
|
12mil
|
|
Maximum joint opening
|
262mil
|
|
Unloading time
|
75s
|
|
Rest period
|
600s
|
|
Total loading cycle time, including rest period
|
750s
|
|
Temperature at AC/PCC interface
|
32° F
|
|
Data collection rate
|
1Hz
|
One of the two slabs on which the overlay is placed is stationary, and the other oscillates under controlled displacement \(u(t)\) (Ref. [2]) :
\(u(t)=u_0+A \Biggl\{ \begin{matrix} \sin^2 (\frac{\pi t}{T}), & t\in [5nT, (5n+1)T] \\ 0, & t\in [(5n+1)T , 5(n+1)T] \end{matrix} \)
Here, t is time in seconds, the loading period T = 150 seconds and the rest period is 4T = 600 seconds, for a total cycle period 5T = 750 seconds. n is an integer number of a cycle, enumeration starts from 0-th cycle, i.e. n = 0,1,2,3, ..... The amplitude of maximum displacement is A = 12 mils, the resting joint opening u0.=250 mils. Figure 7 is a plot of joint opening width over several loading cycles.
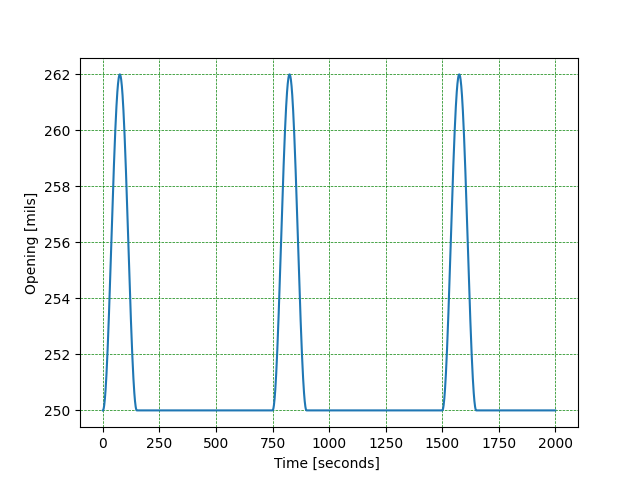
Figure 7. Displacement loadind cycles
Test Results
Crack initiation was determined by analysis of the maximum actuator forces. Actuator force decreases linearly as cracks progress. Crack initiation begins where the plot first intersects a line drawn through the linearly decreasing portion of the plot. Crack initiation is complete when the actuator force levels off after the linearly decreasing portion of the plot. Figure 8 and Figure 9 show the actuator force plots for the three-inch and six-inch test strips, respectively. The load plot for the three-inch strip suggests that crack initiated at 20 cycles. The load plot for the six-inch strip suggests that crack initiated at 100 cycles.
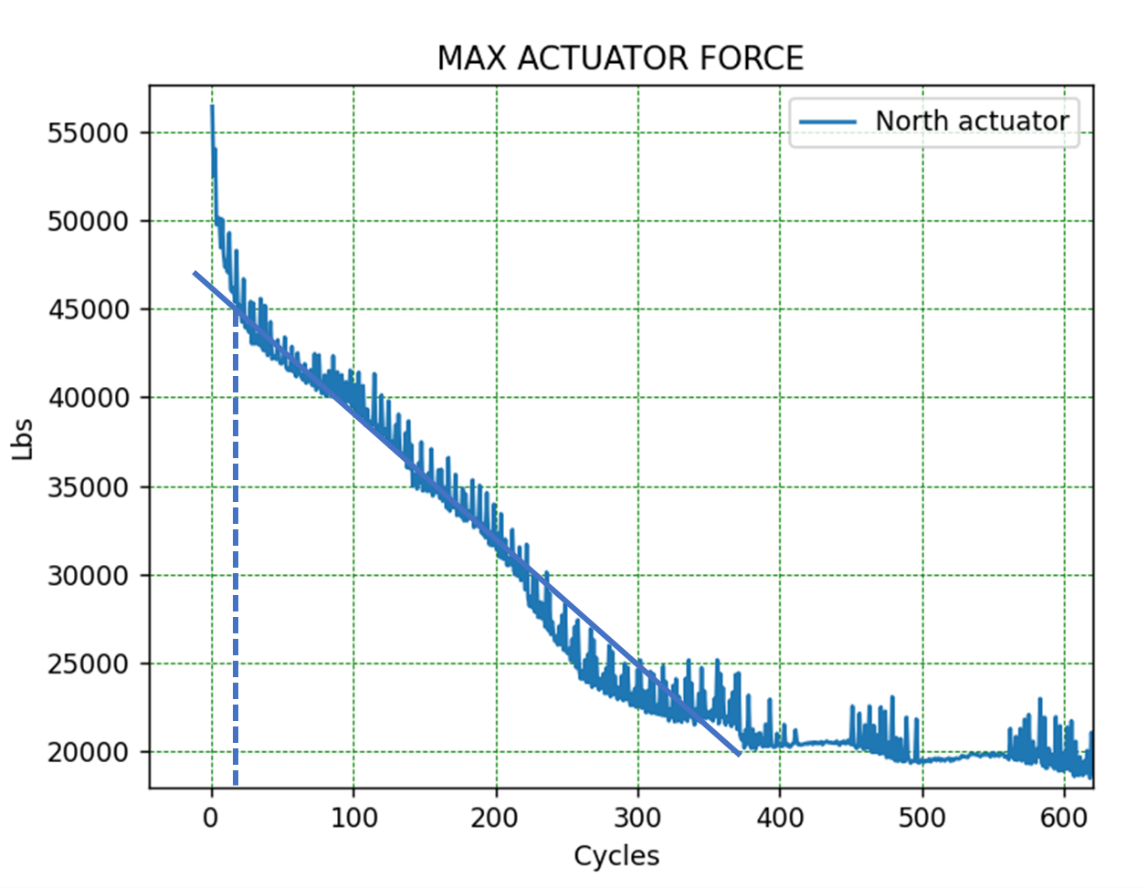
Figure 8. Crack initiation cycle at 3-in test strips. (Click to Zoom)
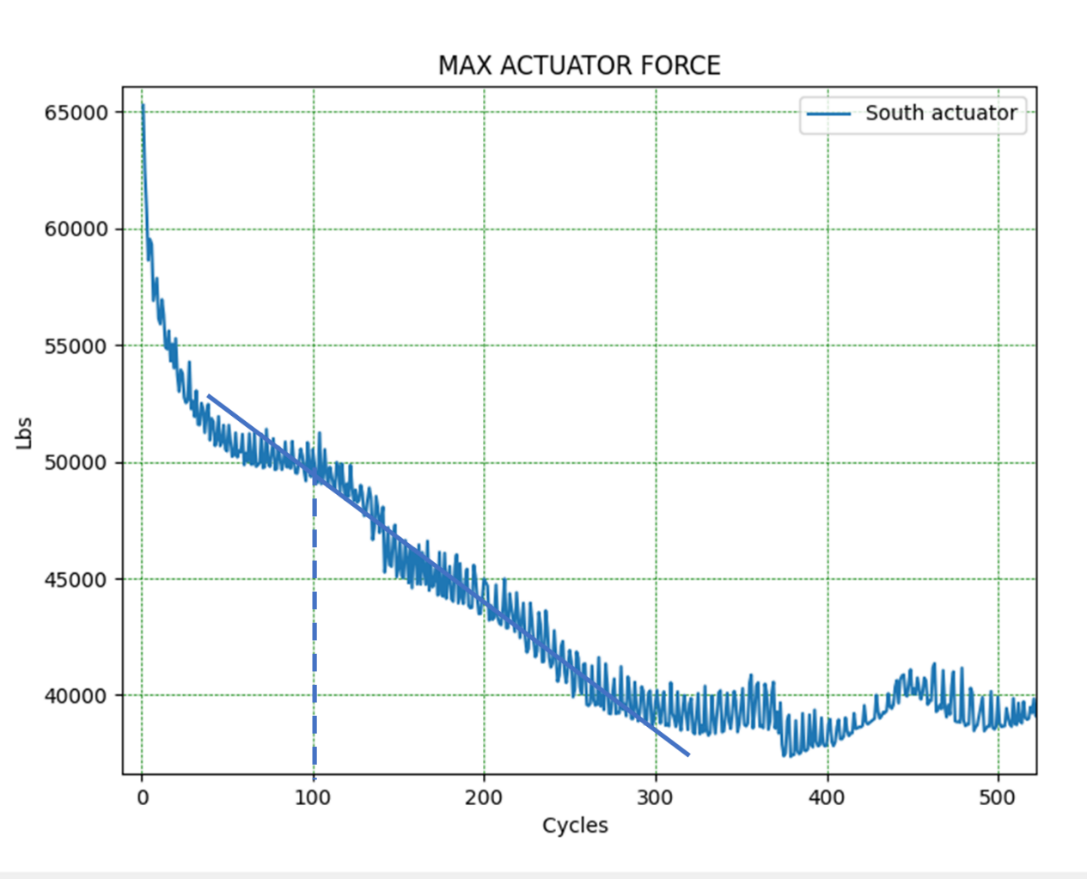
Figure 9. Crack initiation cycle at 6-in test strips. (Click to Zoom)
The surfase strain gauges (SSG) in the three-inch test strip failed within 700 cycles. They indicated strains ranging from about 1950 microstrain to about 2150 microstrain immediately before propagation of the crack through the gauge. The SSG’s in the six-inch test strip failed within 3000 cycles. They indicated strains ranging from 1600 microstrain to 2000 microstrain immediately before propagation of the crack through the gauge.
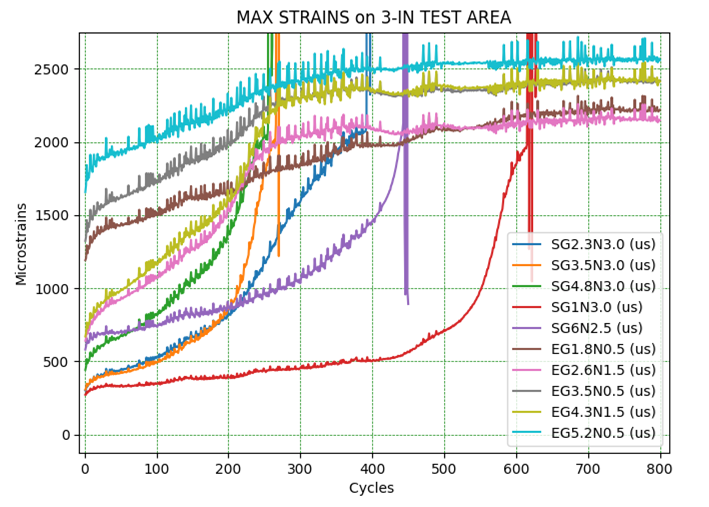
Figure 10. Strain Gauge Responses in Three-Inch Test Strip (Click to Zoom)
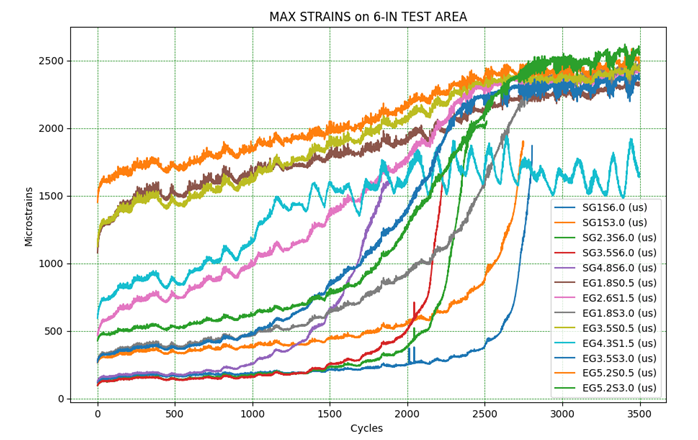
Figure 11. Strain Gauge Responses in Six-Inch Test Strip (Click to Zoom)
Crack progression through an ESG was determined by strain values. It is reasonable to assume that cracks originate closest to the TESS actuators and propagate outward from there. The strain value in the sensor closest to the actuator when the crack initiated was therefore taken as a threshold value indicating the crack tip has reached a sensor. For the three-inch strip, sensor EG5.2N0.5 was closest to the actuator. It indicated a strain of approximately 1900 microstrain when the crack initiated after approximately 20 cycles. This is reasonably close to the strain at which the SSG’s in the three-inch test strip failed. For the six-inch strip, sensor EG5.2S0.5 was closest to the actuator. It indicated a strain of 1600 microstrain when the crack initiated after approximately 100 cycles, which also is reasonably close to when the SSG’s in the six-inch test strip failed. As shown in Figure 10 and Figure 11, these two gauges were the first to reach the threshold, validating the assumption. As the remaining sensors reached these threshold values, researchers assumed the crack had propagated through that sensor.
Comprehensive report for Phase VII can be found here.
Lab Material Characterization
The material characterization plan consists of testing the uncompacted (loose) P-401 mix during construction and field cores after construction. The tests on the loose P-401 mix are summarized in Table 3. All loose mix specimens should be compacted to an air void level that closely matches the field air void level.
Table 3: Summary of proposed tests in the RCID Phase VII Material Characterization Testing Plan on uncompacted (loose) P-401 Asphalt Mix Pavement
|
Test
|
Standard
|
Properties / Parameter
|
|
Bulk Specific Gravity
|
ASTM D2726
|
Bulk specific gravity of asphalt mixture, Gmb
|
|
Maximum Specific Gravity
|
ASTM D2041
|
Maximum specific gravity of asphalt mixture, Gmm
|
|
Gradation
|
ASTM D5444
|
P-401 Gradation
|
|
Asphalt Content
|
ASTM D6307
|
P-401 AC Content |
|
Dynamic Modulus
|
AASHTO T378-17
|
Dynamic modulus and phase angle |
| Overlay Test |
TEX-248-F |
Load, Displacement, and Number of Cycles |
|
Monotonic Disc-Shape Compact Tension
|
ASTM D7313-20 |
Load and Crack Opening Displacement |
|
Cyclic Disc-Shape Compact Tension
|
Chiangmai (Ref. [3]) |
Load and Crack Opening Displacement |
Field extracted samples are tested. 27 field cores are recommended to be taken and tested. An additional 5 cores are recommended to be taken for contingency purposes for a total of 32 field cores. The field core tests, information, and its application to the RCID Phase VII research plan are summarized in Table 4.
Table 4: Summary of proposed tests in the RCID Phase VII Material Characterization Testing Plan on field extracted samples (i.e., field cores)
|
Test
|
Standard
|
Properties / Parameter
|
|
Bulk Specific Gravity
|
ASTM D2726
|
Bulk specific gravity of asphalt mixture, Gmb
|
|
Dynamic Modulus
|
AASHTO T378-17
|
Dynamic modulus and phase angle |
| Overlay Test |
TEX-248-F |
Load, Displacement, and Number of Cycles |
|
Monotonic Disc-Shape Compact Tension
|
ASTM D7313-20 |
Load and Crack Opening Displacement |
|
Cyclic Disc-Shape Compact Tension
|
Chiangmai (Ref. [3])
|
Load and Crack Opening Displacement |
Results from laboratory test can be in Appendices B and C of comprehensive report here.
Conclusions
In Phase VII Test, the effect of overlay thickness on thermally induced reflection cracking was evaluated. Two overlay test strips consisting of the same materials, but different overlay thicknesses (i.e., 3-in. vs. 6-in.) were constructed. Comparison of the overlay performance led to the following conclusions:
- The data collected from RCID Phase VII enlarges the existing reflective cracking database from previous phases. It will aid verification of failure models due to thermally-induced reflective cracking.
- Doubling thickness greatly decreased the total vertical CPR.
- Crack propagation rate is not constant but increases as the crack propagates.
- Despite the CPR starting out an order of magnitude smaller in the six-inch overlay, it required approximately the same number of cycles for a crack to propagate the final (top) three inches of the six-inch overlay as was required to crack all the way through the entire three-inch overlay.
References
- ARA, RCID Phase VII Construction Report, April 2023
- DOT/FAA/TC-20/17, Kairat Tuleubekov, Reflective Crack Propagation Model , published online Reflective Crack Propagation Model (faa.gov), June 2020
- Chiangmai, C.N., Experimental Evaluation of Monotonic and Cyclic Fracture Behavior Using Disk-Shaped Compact Tension Test and Released Energy Approach,” Ph.D. Thesis, University of Illinois at Urbana – Champaign, 2014
Return to Reflective Cracking Overview